Transportation Satellite Accounts Frequently Asked Questions
- What are satellite accounts?
- What are the Transportation Satellite Accounts (TSAs)?
- Why use the Transportation Satellite Accounts to measure the value of transportation?
- What are the U.S. Input-Output (I-O) Accounts?
- How are the U.S Input-Output (I-O) Accounts and the Transportation Satellite Accounts (TSAs) related?
- What is for-hire transportation?
- What is in-house transportation?
- What is household transportation?
- Can you provide an example showing how transportation appears in the Input-Output (I-O) Accounts and the Transportation Satellite Accounts (TSAs)?
- What are the components of the Transportation Satellite Accounts (TSAs)?
- What is the Transportation Satellite Account (TSA) Make Table?
- What is the Transportation Satellite Account (TSA) Use Table?
- What is the Commodity by Industry Direct Requirements Table?
- What is the Commodity by Commodity Direct Requirements Table?
- What is the Industry by Commodity Total Requirements Table?
- What is a final user?
- What is value added?
- What is gross domestic product (GDP)?
- Why is Gross Domestic Product (GDP) larger in the Transportation Satellite Account (TSA) Use Table than in the Input-Output (I-O) Use Table?
- What is the amount of transportation used by each industry?
- Where can I find the contribution of transportation to the economy as measured by GDP?
- How much transportation does an industry require to produce $1 of output?
- How much transportation is required to deliver an additional $1 of a commodity to a final user?
Satellite industry accounts expand upon national income and product accounts and input-output accounts and rearrange these accounts to focus on a particular aspect of economic activity.
The Transportation Satellite Accounts (TSAs) expand upon the U.S. Input-Output (I-O) Accounts data published by the U.S. Department of Commerce’s Bureau of Economic Analysis (BEA).
For a list of U.S. satellite industry accounts, see http://www.bea.gov/industry/index.htm#satellite
What are the Transportation Satellite Accounts (TSAs)?
The Transportation Satellite Accounts (TSAs), produced by the Bureau of Transportation Statistics (BTS), provide a comprehensive measure of transportation activity (e.g., trucking carried out by groceries to move goods from distribution centers to stores and driving by households in personal motor vehicles) in the U.S. The I-O accounts, produced by BEA, show the contribution of the for-hire transportation industry to the U.S. economy and the industries using for-hire transportation services. For-hire transportation consists of the services provided by transportation firms to industries and the public on a fee-basis, such as air carriers, railroads, transit agencies, common carrier trucking companies, and pipelines. The TSAs add onto the I-O accounts to show the dollar value of transportation activity carried out by nontransportation industries for their own purposes (known as business-related in-house transportation) and transportation activity carried out by households through the use of their private motor vehicle (known as household production of transportation services (HPTS)) – neither of which are shown in the I-O accounts. The contribution of household transportation is equal to the depreciation of owning and operating a motor vehicle. The time households spend operating a private motor vehicle for personal use is not included, because it is not within the scope of the I-O accounts, upon which the TSAs are built. The I-O accounts, by design, do not include unpaid labor, volunteer work, and other non-market production.
The TSAs show the contribution of not only the for-hire transportation industry but also in-house and household transportation activity to the economy. The contribution of transportation to the economy is equal to dollar value of the transportation activity less the sum of the inputs (e.g., fuel, vehicle parts, etc.) used. Economists call this a production based approach in estimating the contribution of transportation activity. The contribution from non-market inputs (such as the time a household spends driving their own a motor vehicle) are not included.
Why use the Transportation Satellite Accounts to measure the value of transportation?
The Transportation Satellite Accounts (TSAs) measure the value of transportation as the contribution of transportation as an industry to the national economy. Prior to the TSAs, the contribution of transportation had long been underestimated, as most national measures counted only the contribution of the for-hire transportation industry. The TSAs capture the contribution of transportation operations carried out by not only the for-hire transportation industry but also nontransportation industries (termed as in-house transportation).
Measuring the contribution of the transportation industry is important:
- To quantify the role of transportation industries and transportation activity in the economy
- To quantify the inputs required to produce transportation services (see FAQ What is the Use Table?)
- To highlight the relative importance of transportation services to the production of output by individual industries (see FAQ What is the Commodity by Industry Direct Requirements Table?)
- To quantify the amount of transportation services required to deliver goods (e.g., manufacturing products) to final consumers (see FAQ What is the Commodity by Commodity Total Requirements Table?)
- To quantify the amount of transportation activity required to fulfill demand (see FAQ What is the Industry by Commodity Total Requirements Table?)
- To quantify the demand transportation industries generate for output from non-transportation industries (see FAQ What is the Industry by Commodity Total Requirements Table?)
What are the U.S. Input-Output (I-O) Accounts?
The U.S. Department of Commerce’s Bureau of Economic Analysis (BEA) produces the U.S. Input-Output (I-O) Accounts. The accounts belong to the U.S. national economic accounts. The U.S. national economic accounts consist of the national income and product accounts (NIPA), the industry accounts, and the financial accounts of the U.S . The industry accounts include the I-O accounts. The I-O accounts provide a “coherent and comprehensive picture of the nation’s economy” (BEA). They provide an understanding about the size and composition of the economy. Specifically, the I-O Accounts show the inputs each industry uses to produce output, the type of output produced by each industry, and the types of products purchased by final consumers.
For more information on the U.S. I-O Accounts, see Concepts and Methods of the U.S. Input-Output Accounts, U.S. Department of Commerce, Bureau of Economic Analysis, April 2009: http://www.bea.gov/papers/pdf/IOmanual_092906.pdf
How are the U.S Input-Output (I-O) Accounts and the Transportation Satellite Accounts (TSAs) related?
The benchmark U.S. Input-Output (I-O) data provides detailed information on the inputs used by each industry to produce its output, the goods produced by each industry, and the goods used by final consumers. For-hire transportation is one of the industries in the I-O accounts. For-hire transportation consists of the services provided by transportation firms to industries and the public on a fee-basis, such as air carriers, railroads, transit agencies, common carrier trucking companies, and pipelines. The Transportation Satellite Accounts (TSAs) rearrange the I-O accounts to show the dollar value of transportation activity carried out by nontransportation industries for their own purposes (known as business-related in-house transportation activity) and add transportation activity carried out by households through the personal use of motor vehicles. The contribution of household transportation activity is equal to the depreciation of owning and operating a motor vehicle. The time households spend operating a private motor vehicle for personal use is not included, because it is not within the scope of the U.S. Input-Output (I-O) accounts, upon which the TSAs are built. The I-O accounts, by design, do not include unpaid labor, volunteer work, and other non-market production.
What is for-hire transportation?
For-hire transportation consists of the services provided by transportation firms to industries and the public on a fee-basis. Airlines, railroads, transit agencies, common carrier trucking companies, and pipelines are examples of for-hire transportation industries.
What is in-house transportation?
In-house transportation consists of the services provided by businesses and households for their own use. Business in-house transportation consists of the services carried out by non-transportation industries using privately owned and operated vehicles of all body types, used primarily on public rights of way. The dollar value of the business in-house transportation includes the support services to store, maintain, and operate those vehicles. A baker’s delivery truck is an example of business in-house transportation activity. Large in-house transportation activities such as the trucking fleet for Target, Walmart or Home Depot are included by BEA in their estimation of for-hire transportation activity.
What is household transportation?
Household transportation covers transportation activity carried out by households for their own use through the use of a motor vehicle. The contribution of household transportation activity is equal to the depreciation of owning and operating a motor vehicle. The time households spend operating a private motor vehicle for personal use is not included, because it is not within the scope of the U.S. Input-Output (I-O) accounts, upon which the Transportation Satellite Accounts (TSAs) are built. The I-O accounts, by design, do not include unpaid labor, volunteer work, and other non-market production.
Can you provide an example showing how transportation appears in the Input-Output (I-O) Accounts and the Transportation Satellite Accounts (TSAs)?
An example of a simple economy demonstrates how transportation services purchased by non-transportation industries appears in the I-O accounts and the TSAs. In both the I-O accounts and the TSAs, transportation services purchased appears alongside all other purchases made in the economy.
Suppose there is a simple economy that produces bread. There is a farm that grows the wheat; a mill that purchases the wheat from the farmer and grinds it into flour, a bakery that buys the flour from the mill and turns the flour into bread; and a store that buys the bakery’s bread and sells it to households.
The example below walks through the story using a table to track the value of the wheat, flour, and bread. Suppose the mill purchases the wheat from the farmer for $0.80, the bakery purchases the flour from the mill for $1.00, and the retail store purchases the bread from the bakery for $2.50. In the I-O accounts, each transaction appears as a purchase made by the respective industry. Table 1 is a simple I-O table that shows all the purchases made in the simple economy. The $0.80 purchase of wheat by the mill appears below the mill column (a), the $1.00 purchase of flour by the bakery appears below bakery column (b), and the $2.50 purchase of bread by the retail store appears below the retail store column (c).
Table 1. Capturing the Dollar Value of Truck Transportation Services Purchased for a Fee (For-hire Truck Transportation Services) in the Input-Output Accounts (Simplified Example)
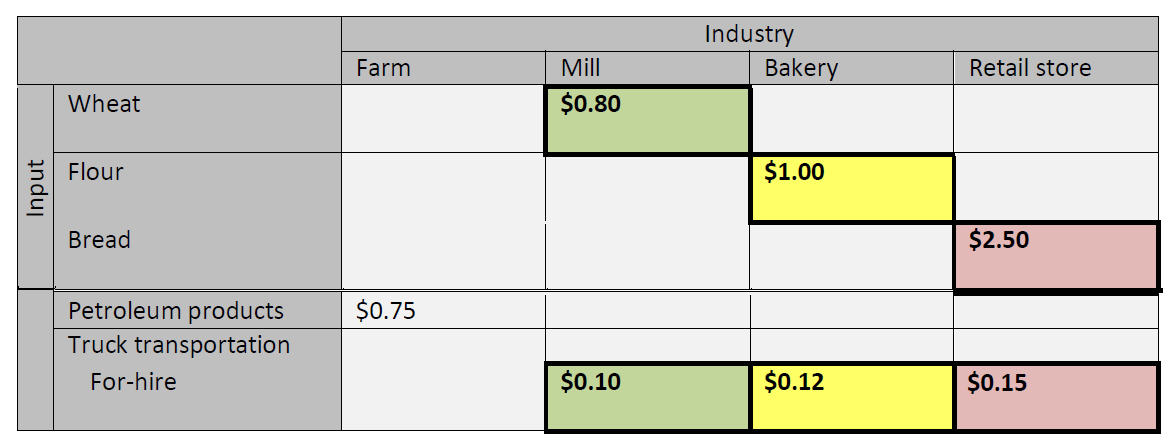
NOTES: For-hire transportation consists of the services provided by transportation firms to industries and the public on a fee-basis.
To account for the costs of transporting wheat, flour, and bread, this simple example can be expanded to include for-hire transportation services purchased to move these goods in the simple economy. Suppose a for-hire trucking company moves the wheat to the mill, the flour to the bakery, and the bread to the store for a fee. The I-O accounts show all transportation services purchased from for-hire trucking companies. In the I-O accounts, the industry purchasing the transported good appears as the purchaser of the transportation service. For example, suppose the farm pays a truck company $0.10 to deliver wheat to the mill. Even though the farm paid for the transportation services, the mill (in the I-O accounts) appears as the purchaser of the $0.10 of truck transportation services, as shown in Table 1. Likewise, if the mill pays a truck company $0.12 to deliver flour to the bakery, the bakery appears as the purchaser of the $0.12 of transportation services, as shown in Table 1. If the retail store pays $0.15 for a truck to deliver bread from the bakery, the retail store appears as the buyer, as shown in Table 1.
Now suppose instead that the farm uses its own truck to move wheat to the mill. The dollar value of the transportation services used to move wheat to the mill would not appear in the I-O accounts. The I-O accounts show only the purchase of goods. If the farm uses its own truck, then neither the farm nor the mill needs to purchase truck transportation services from a for-hire truck company. The farm would need to purchase motor fuel (a petroleum product) to operate its own trucks, and the I-O accounts would show the farm’s total purchase of motor fuel.
To move the wheat, the farmer would need to purchase fuel. Suppose the farm purchases $0.75 of petroleum products. The TSAs extract the dollar value of transportation services provided by the farm to carry its own products from the dollar value of petroleum purchased. A portion of the value of petroleum used by the farm goes toward transportation operations and the other goes toward other purposes, such as the operation of farm machinery. Table 2 shows the process of creating a simple TSA table from a simple I-O table. Suppose the farm uses $0.70 of petroleum for other purposes and uses the remaining $0.05 to operate a truck to move wheat to the mill. The $0.05 would appear as a purchase of in-house transportation services by the farm in the TSAs (blue box in Table 2). Since $0.05 of petroleum products were re-assigned to in-house transportation, the value of petroleum products purchased by the farm would be reduced by $0.05 from $0.75 to $0.70 (Table 2). In the TSAs, the nontransportation industry carrying out transportation activity for its own purposes always appears as the purchaser of in-house transportation services.
Table 2. Capturing the Dollar Value of Truck Transportation Activity Carried Out by a Farm for its Own Purposes (In-house Truck Transportation Activity) in the Transportation Satellite Accounts (Simplified Example)
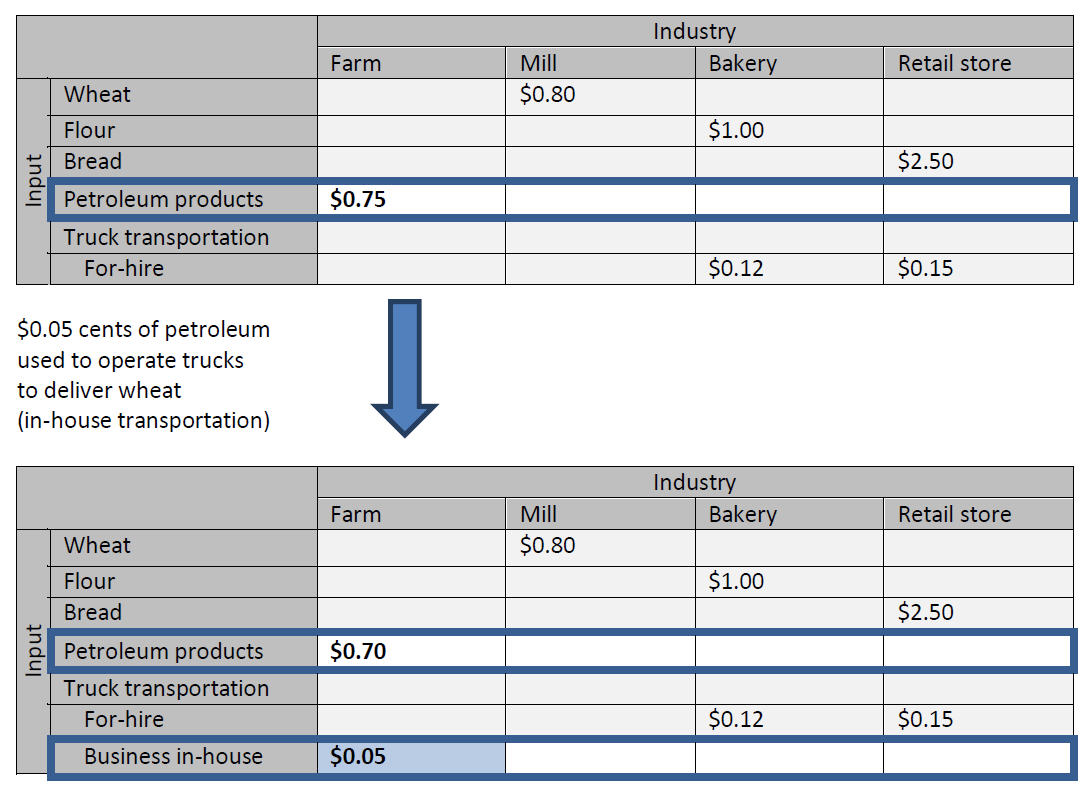
NOTES: For-hire transportation consists of the services provided by transportation firms to industries and the public on a fee-basis. Business in-house transportation consists of the transportation activity carried out by non-transportation industries for their use.
Now let us add households that drive their own motor vehicles to purchase bread from the retail store. The value of the transportation activity would not appear as a purchase made by households, because the I-O accounts do not include households. The TSAs add households, because households produce their own transportation, i.e., they drive their own motor vehicles for personal purposes.
Suppose each household already owns a motor vehicle and only needs motor fuel to operate their motor vehicle. The I-O accounts categorize motor fuel purchases as a personal expenditure made by final consumers. The TSAs reclassify motor fuel purchases as purchases made by households to own and operate a motor vehicle for their own purposes. Returning to the simple economy, suppose personal expenditures on petroleum products are $0.07 and $0.02 of petroleum purchases are on motor fuel. Table 3 shows the addition of household transportation activity to a simple TSA table through the reclassification of the motor fuel. The $0.02 appears as a purchase made by households to operate their own car and personal expenditures on petroleum are reduced by $0.02 from $0.07 to $0.05. The TSA captures the value of products used by the household to operate their personal motor vehicles, but it does not include or attempt to estimate the value of time for driving.
Table 3. Capturing the Dollar Value of Household Transportation Activity in the Transportation Satellite Accounts (Simplified Example)
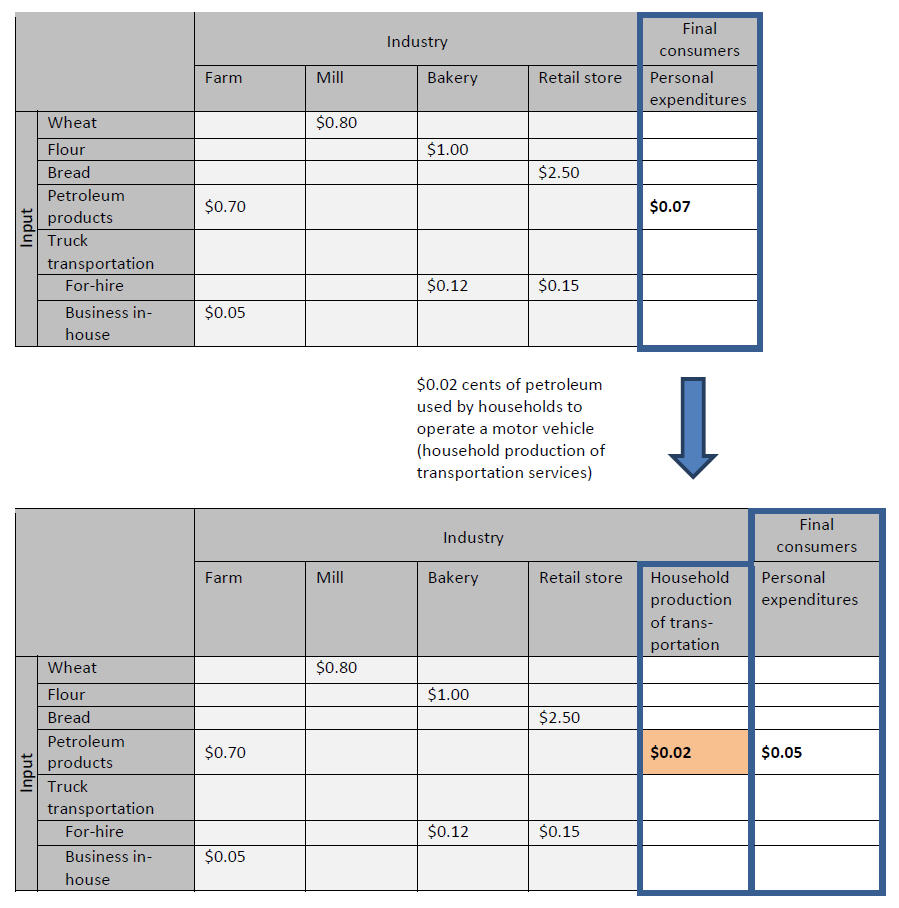
NOTES: For-hire transportation consists of the services provided by transportation firms to industries and the public on a fee-basis. Business in-house transportation consists of the transportation activity carried out by non-transportation industries for their use. Household production of transportation includes only travel in motor vehicle owned, leased, or rented and operated by households themselves.
What are the components of the Transportation Satellite Accounts (TSAs)?
The Transportation Satellite Accounts (TSAs) use the same structure as the U.S. Input-Output (I-O) accounts and consist of four tables:
- make (the dollar value of transportation services each transportation industry makes),
- use (the dollar value of the transportation services used by each industry in the economy),
- direct requirements (the dollar value of transportation services required to produce one dollar of each product), and
- total requirements (the dollar value of the inputs required to produce one dollar of transportation).
The I-O tables include six for-hire transportation industries (air, rail, truck, passenger and ground transportation, pipeline, and other transportation and support services). The TSAs expand each table to include five in-house transportation modes (air, rail, water, and truck transportation) used for business activities. The TSAs also add household transportation, which covers transportation activity carried out by households for their own purposes through the use of a motor vehicle. As in the I-O accounts, household travel by air and taxi are part of for-hire air transportation.
What is the Transportation Satellite Account (TSA) Make Table?
The Make Table provides the dollar value of transportation services each transportation industry makes.
The Make Table shows the dollar value of the commodities, also known as goods, made by each industry. Commodities are presented in columns and industries in rows, as shown in Table 4. The entries across a row represent the dollar value of the commodity produced by an industry. An industry may produce more than one commodity. The diagonal cells in the Make Table (bolded in Table 4) show the dollar value of the commodity produced by the industry that is the “primary” producer. The values in the off-diagonal cells in the Make Table show the dollar value of the commodity produced as secondary products. As shown in Table 4, the row for manufacturing shows that the manufacturing industry produced $5,603,320 million of manufactured products and secondarily, $689 million of agriculture and mining products for a total production of $5,641,440 million. The column for manufacturing shows that the manufacturing industry produced 99 percent of all manufactured products ($5,603,320 million / $5,638,934 million). The agriculture and mining industry produced the remaining one percent of manufactured products as secondary products.
The Transportation Satellite Account (TSA) Make Table shows the production of not only for-hire transportation services (similar to the I-O accounts) but also, in-house, and household transportation activity. For example, the for-hire truck transportation row in Table 4 shows that the for-hire truck transportation industry produced truck services ($293,451 million). The for-hire truck transportation column shows that other for-hire transportation firms also produced for-hire truck transportation services ($259 million) (other for-hire transportation includes firms providing supportive services to truck transportation operations). The in-house truck transportation row and column show the total value of in-house truck transportation activity ($414,159 million), and the household transportation row and column show the output value for household transportation activity ($808,575 million).
Table 4. Example Make Table in the Transportation Satellite Accounts
(millions)
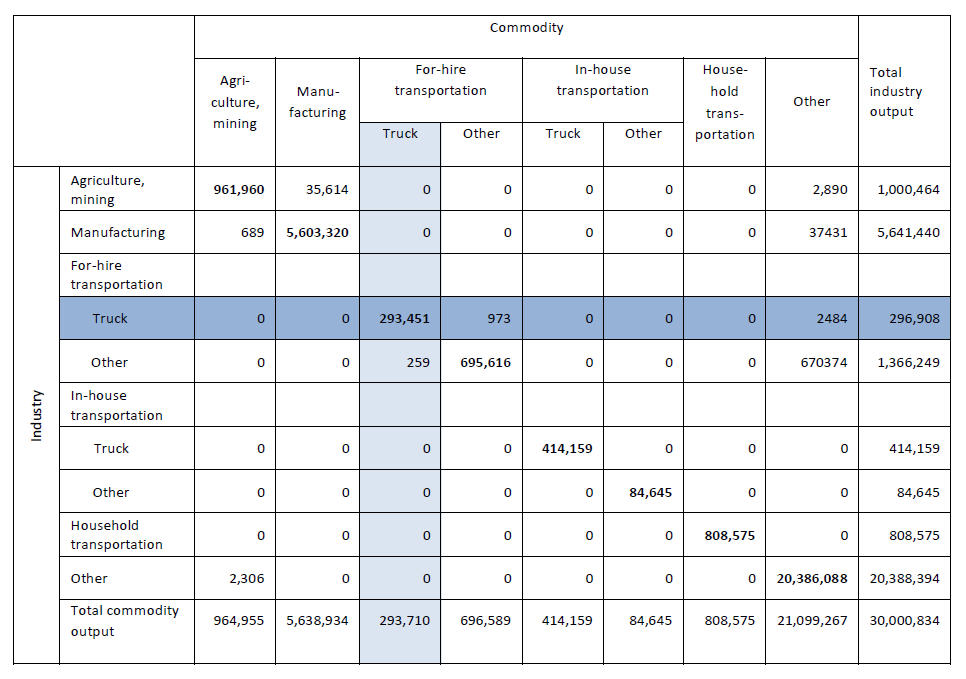
NOTES: For-hire transportation consists of the services provided by transportation firms to industries and the public on a fee-basis. Business in-house transportation consists of the transportation activity carried out by non-transportation industries for their use. Household production of transportation includes only travel in motor vehicle owned, leased, or rented and operated by households themselves.
What is the Transportation Satellite Account Use Table?
The Use Table shows:
- the dollar value of transportation services used by an industry, and
- the contribution of each transportation mode to the economy (as measured by GDP).
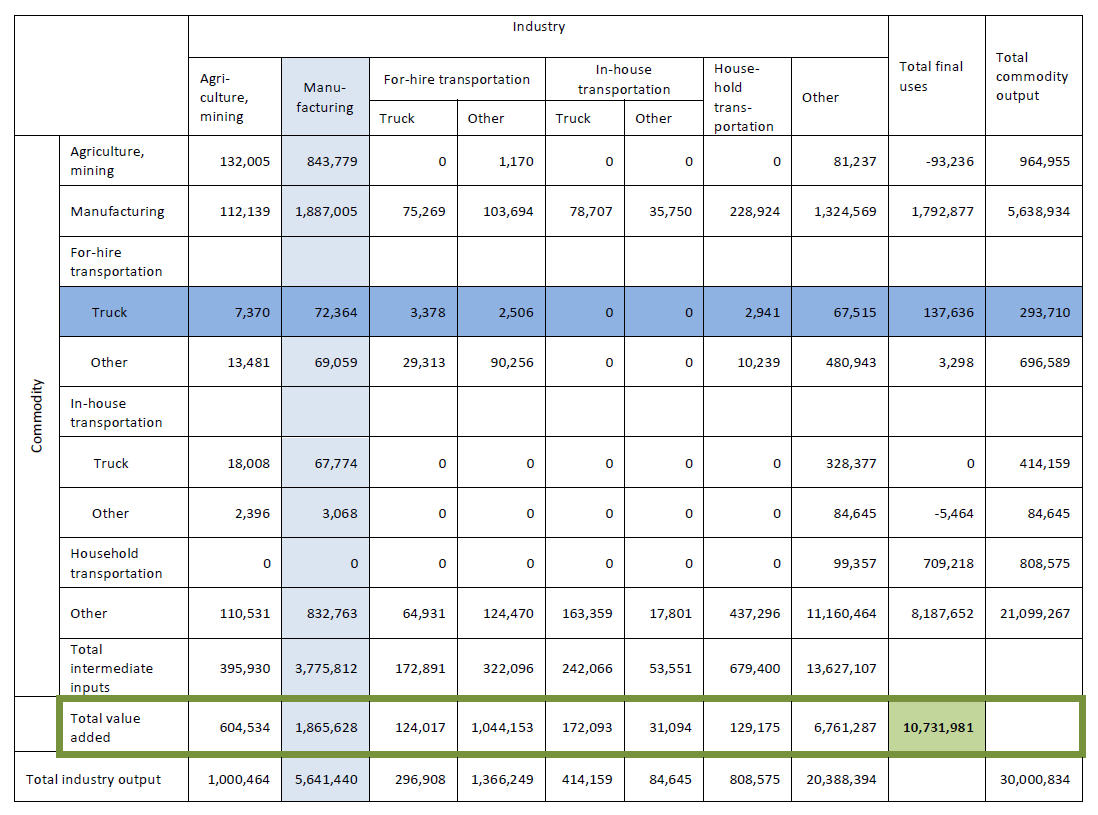
The Use Table shows the dollar value each commodity used by an industry during production and by final users[1]. The rows in the Use Table show the dollar value of the commodities. The sum of each row is the gross output of that commodity. For example, the for-hire truck transportation row in Table 5 shows the dollar value of for-hire truck transportation services used by each industry and for final purposes – the sum of which equals the total dollar value of for-hire truck transportation services used in the economy (total commodity output). The agriculture and mining industry used $7,370 million of for-hire truck transportation services; while the manufacturing industry used $72,364 million. Final users consumed $137,637 million of for-hire truck transportation services.
Each column in the Use Table displays the industries and final users that use the commodities. The columns can be thought of as the recipe for producing output. For example, the manufacturing column in Table 5 shows that the manufacturing industry required inputs from multiple areas of the economy, including $843,779 million of agricultural and mining products, $1,887,005 of manufacturing products, $72,364 of for-hire truck transportation services, $69,059 million of other for-hire transportation services, and $832,763 of other goods and services. The manufacturing industry additionally carried out $67,774 of in-house truck transportation activity and $3,068 of other in-house transportation activity to produce output. In total, the manufacturing industry needed $3,775,812 million of commodities ($843,779 + $1,887,005 + $72,364 + $69,059 + $67,774 + $3,068 + $832,763) to produce manufacturing products.
The Use Table also shows the dollar value each industry adds to GDP. For each industry, there is a row called “value-added” that appears below the rows listing the commodities used by the industry to produce output. Value-added is the income generated by production. More specifically, it is the value of the industry’s sales to other industries and final users less the value of its purchases from other industries[2]. The sum of the value-added by each industry is equal to GDP for the nation. In Table 5, the value added row (outlined in green) shows that the for-hire truck transportation industry contributed $124,017 million to GDP. In-house truck transportation operations contributed $172,093 and households contributed $129,175 million in owning and operating a personal motor vehicle for their own purposes[3]. Other for-hire transportation industries contributed $1,044,153 million and other in-house transportation operations contributed $31,094 million. In total, transportation activity contributed $1,500,532 million to the economy. GDP is equal to $10,731,981 million and is the sum of the value added by all industries. Transportation activity accounted for 14 percent of GDP, in this example.
For more information on GDP, see What is gross domestic product (GDP)?
Table 5. Example Use Table in the Transportation Satellite Accounts
(millions)
NOTES: Final uses refers to the purchase of goods to satisfy current wants or needs. In other words, the goods they purchase are not used in the production of another good. For-hire transportation consists of the services provided by transportation firms to industries and the public on a fee-basis. Business in-house transportation consists of the transportation activity carried out by non-transportation industries for their use. Household production of transportation includes only travel in motor vehicle owned, leased, or rented and operated by households themselves.
What is the Commodity by Industry Direct Requirements Table?
The Commodity by Industry Direct Requirements Table shows the importance of transportation in the production process, i.e., the dollar value of transportation services an industry requires to produce one dollar of output.
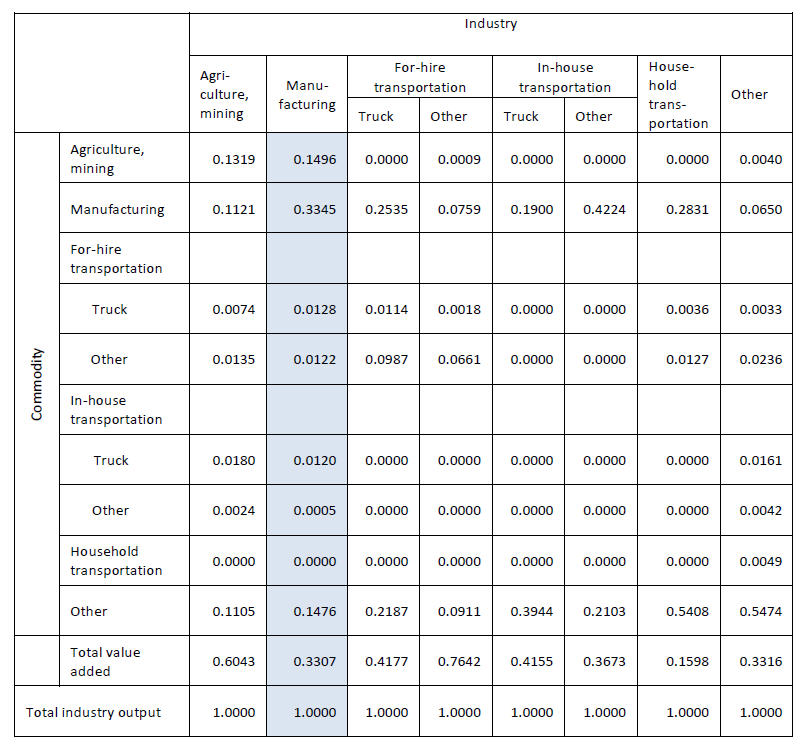
The Commodity by Industry Direct Requirements Table shows the dollar value of each commodity used by an industry per dollar of industry output. The table is similar to the Use Table except that the values are per dollar of industry output rather than absolute dollars. For example, the manufacturing column in Table 6 shows that the manufacturing industry required 1¢ (0.0128 *100) of for-hire truck transportation services, 1¢ (0.0122 *100) of other for-hire transportation services, 1¢ (0.0120 *100) of in-house truck transportation operations, 0.05¢ (0.0005 *100) of other in-house transportation operations to produce one dollar of output. In total, the manufacturing industry required 3.75¢ (0.0128 + 0.0122 + 0.0120 + 0.0005) of transportation services and operations to produce a dollar of output.
When represented per dollar of industry output, the importance of transportation in the production process can be measured relative to other industries. The manufacturing industry required 3.75¢ of transportation services to produce a dollar of output, whereas the agriculture and mining industry required 4.13¢. Industries producing more output tend to use a larger dollar value of transportation services because of their greater output. They, however, may use transportation services less intensely than industries producing less output (again measured in absolute dollars) if they require less transportation services per dollar of industry output. This may result, for example, from greater production efficiency and/or from consuming transportation services that cost less. Table 5 shows that the manufacturing industry produces more output and uses more transportation services than the agriculture and mining industry. The agriculture and mining industry, however, requires more transportation services per dollar of output (4.13¢) than the manufacturing industry (3.75¢) (table 6).
The importance of transportation in the production process also can be measured relative to all other inputs. Table 6 shows that the manufacturing industry requires more agriculture and mining products (14.96¢) to produce a dollar of output than transportation services, thus making agriculture and mining a more important input in the production of manufacturing products.
Table 6. Example Direct Requirements Table in the Transportation Satellite Accounts
(dollars required per dollar of output)
NOTES: For-hire transportation consists of the services provided by transportation firms to industries and the public on a fee-basis. Business in-house transportation consists of the transportation activity carried out by non-transportation industries for their use. Household production of transportation includes only travel in motor vehicle owned, leased, or rented and operated by households themselves.
What is the Commodity by Commodity Direct Requirements Table?
The Commodity by Commodity Direct Requirements Table shows the inputs required to deliver one dollar of transportation services to final users.
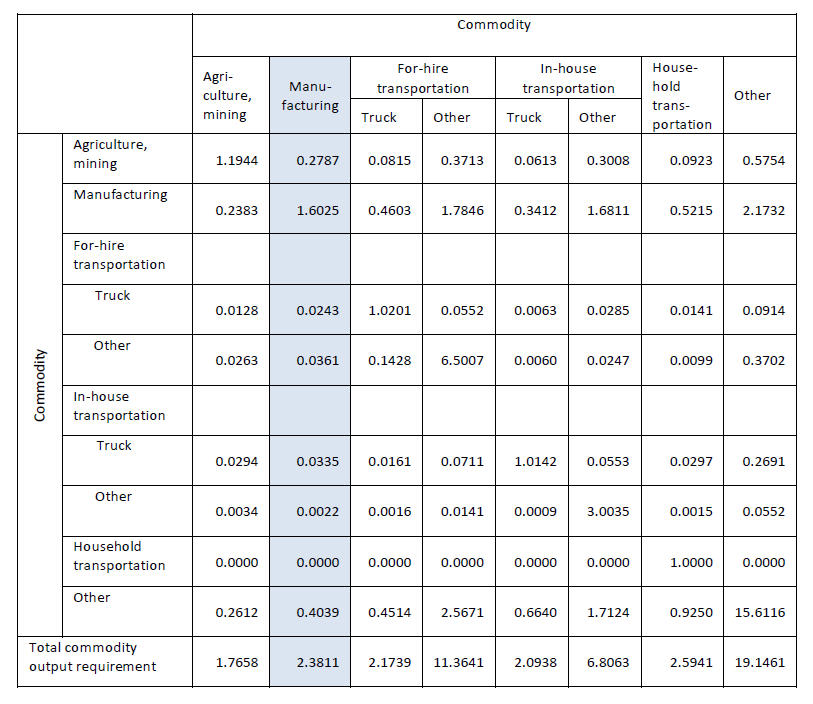
The Commodity by Commodity Direct Requirements Table (Table 7) shows the inputs required to deliver a dollar of a given commodity to final users. The data read down a column. As shown in Table 7, providing one dollar of manufactured products to final users, required 28¢ (0.2787 *100) of agriculture and mining products, 160¢ (1.6025 *100) of manufacturing products, 2¢ (0.0243 * 100) of for-hire truck transportation services, 4¢ (0.0361 *100) of other for-hire transportation services, 3¢ (0.0335 * 100) of in-house truck transportation operations, less than 1¢ (0.0022 * 100) of other in-house transportation operations, and 40¢ (0.4039 * 100) of products from other industries. In total, every dollar of for-hire transportation services provided to final users requires $2.38 of inputs (as shown by the total commodity requirement at the bottom of the manufacturing column). Delivering one dollar of manufactured products to final users requires more than one dollar of inputs because not all of the manufactured products reach final consumers. Some of the manufactured products are used as an input in the production of manufactured products themselves or in the production of another good.
The values in the Commodity by Commodity Direct Requirements Table differ from the values in the Commodity by Industry Direct Requirements Table, because commodities may be produced by more than one industry. For example, the agriculture industry is the primary producer of agricultural and mining products (as seen in the Make Table - Table 4) but other industries, such as the manufacturing industry, are secondary producers also make agricultural and mining products. The amount of transportation services required to deliver a dollar of a commodity to final users, depends on the amount required by all industries (primary and secondary) making the commodity.
Table 7. Example Commodity by Commodity Requirements Table in the Transportation Satellite Accounts
(dollar required per dollar delivered to final users)
NOTES: For-hire transportation consists of the services provided by transportation firms to industries and the public on a fee-basis. Business in-house transportation consists of the transportation activity carried out by non-transportation industries for their use. Household production of transportation includes only travel in motor vehicle owned, leased, or rented and operated by households themselves.
What is the Industry by Commodity Total Requirements Table?
The Industry by Commodity Total Requirements Table shows:
- dollar value of transportation services required to fulfill the demand from final users in the economy and
- the demand transportation industries generate for output from nontransportation industries
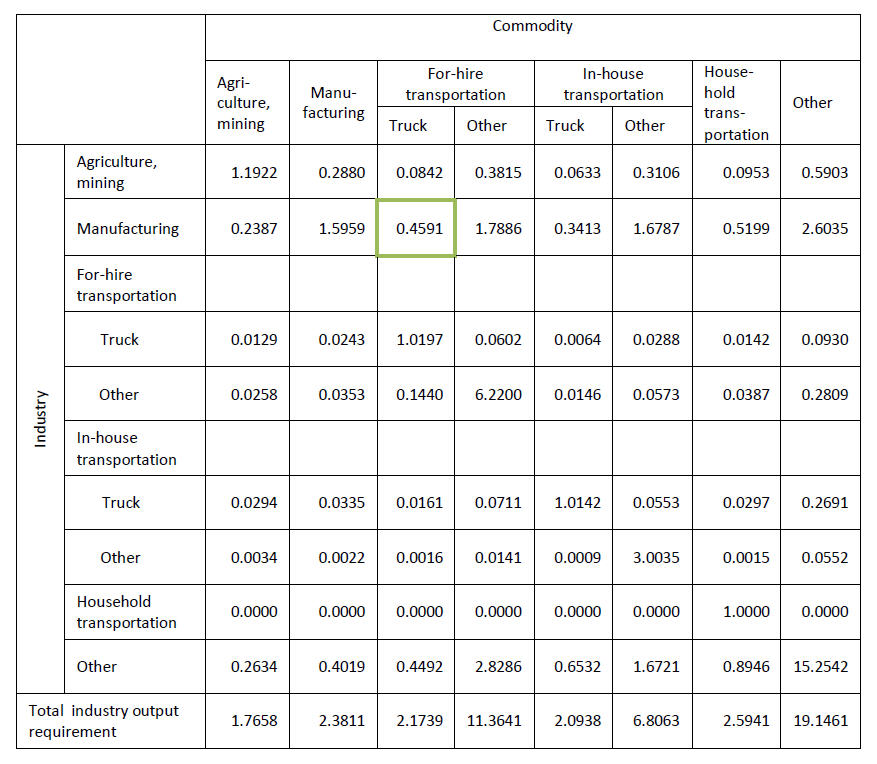
The Industry by Commodity Total Requirements Table shows the production required by an industry to deliver one dollar of a given commodity to final users. The table is useful for measuring the direct and indirect effects of transportation activity on the economy. The direct effect is the amount of transportation output required to fulfill demand. This can be seen in Table 8. The columns show the amount of output that each industry (shown on a row) must produce to provide final users with one dollar of the commodity listed at the column head. The for-hire truck transportation industry, for example, must produce $1.02 of output to provide final users with one dollar of truck transportation services. A portion of the for-hire truck transportation industry’s output will be used as an input by other industries and hence, will not reach final users. For this reason, the truck transportation industry must produce more than one dollar of truck transportation services to deliver a dollar of output to final users.
The Industry by Commodity Total Requirements Table also can be used to measure the indirect effects of transportation activity on the economy. The indirect effect is the demand transportation industries generate for output from nontransportation industries. The for-hire truck transportation industry, for example, requires fuel and tires in order to produce truck transportation services. In the industry by commodity total requirement table, the values below the transportation columns are the amount of industry (e.g., in natural resources and mining, construction, etc.) output needed to provide a dollar of transportation services to final users. For example, to provide final users with one dollar of for-hire truck transportation services, the manufacturing industry must provide 46¢ (0.4591 * 100) of output (outlined in green in Table 9).
The value of the products needed to produce a dollar of transportation services for final consumption is given by the total industry output requirement at the bottom of the transportation columns in the industry by commodity total requirement table. As shown in Table 8, one dollar of for-hire transportation services delivered to final users requires $2.17 of products ($0.0842 from the agriculture and mining industry, $0.4591 from the manufacturing industry, etc.). Output will increase by a larger amount when a larger number of commodities are required to support the increase and/or when the required commodities are more costly to produce.
Table 8. Example Industry by Commodity Total Requirements Table in the Transportation Satellite Accounts
(dollars required per dollar delivered to final users)
NOTES: For-hire transportation consists of the services provided by transportation firms to industries and the public on a fee-basis. Business in-house transportation consists of the transportation activity carried out by non-transportation industries for their use. Household production of transportation includes only travel in motor vehicle owned, leased, or rented and operated by households themselves.
Final users refers to those in the economy who purchase goods to satisfy current wants or needs. In other words, the goods they purchase are not used in the production of another good.
Value-added is the income generated by production. More specifically, it is the value of the industry’s sales to other industries and final users less the value of its purchases from other industries. In the TSA Use Table, value-added is the sum of three components: (1) compensation to employees, (2) taxes on production and imports less subsidies, and (3) gross operating surplus. In the TSA Use Table, the sum of the value-added by each industry is equal to GDP for the nation.
What is gross domestic product (GDP)?
Gross domestic product (GDP) measures the value of final goods and services produced in the U.S. in a given period of time. GDP appears in the Use Table and can be measured in three ways: (1) sum of value added, (2) sum of total final uses, and (3) total output less total intermediate inputs (see table 9).
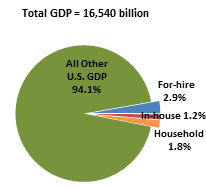
In the Transportation Satellite Account (TSA) Use Table, GDP is larger than in the Input-Output (I-O) Use Table because the TSA Use Table adds the contribution of household travel by personal motor vehicle to the table (see Figure 1).
Table 9. Gross Domestic Product in Example Transportation Satellite Accounts Use Table
(millions)
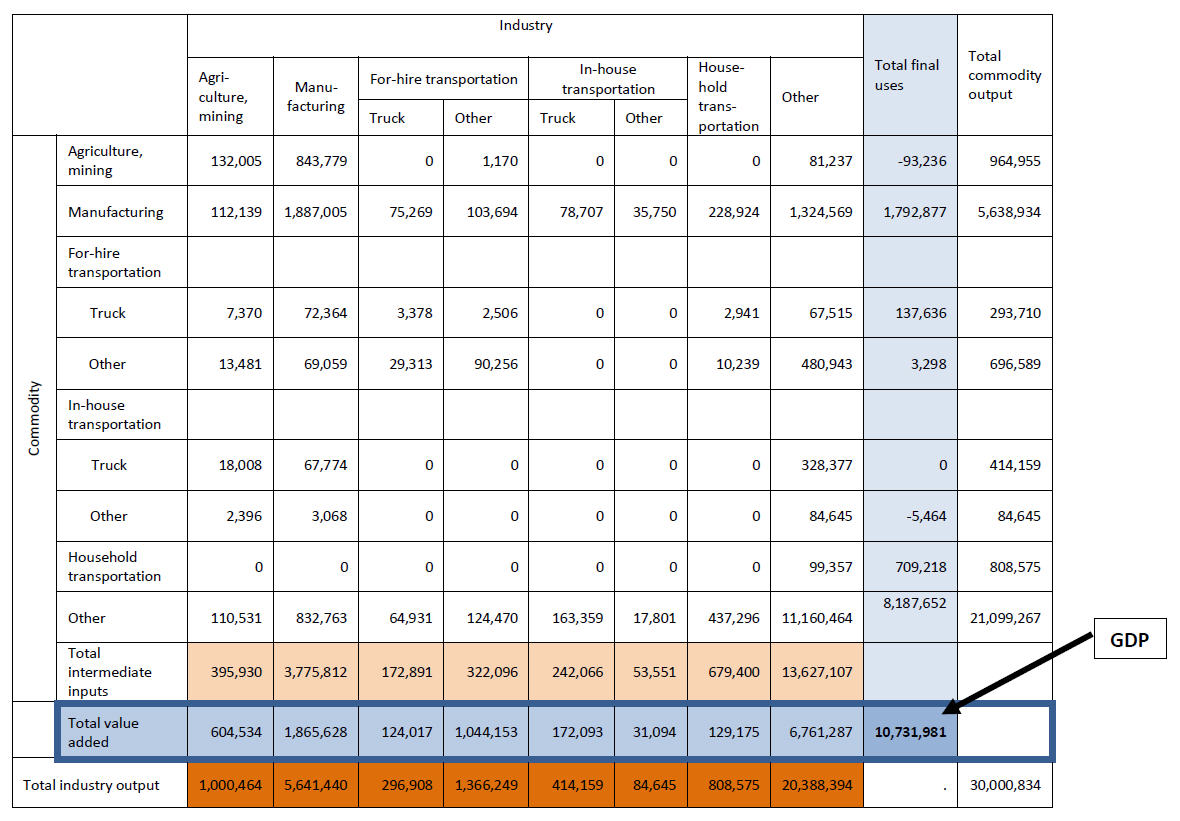
NOTES: Final uses refers to the purchase of goods to satisfy current wants or needs. In other words, the goods they purchase are not used in the production of another good. For-hire transportation consists of the services provided by transportation firms to industries and the public on a fee-basis. Business in-house transportation consists of the transportation activity carried out by non-transportation industries for their use. Household production of transportation includes only travel in motor vehicle owned, leased, or rented and operated by households themselves. Gross domestic product (GDP) can be measured in three ways: (1) sum of value added, (2) sum of total final uses, and (3) total output less total intermediate inputs.
Figure 1. Contribution of For-Hire and In-House Transportation to U.S. Gross Domestic Product (GDP) (2012 dollars)
Economic Activity
Contribution to Gross Domestic Product
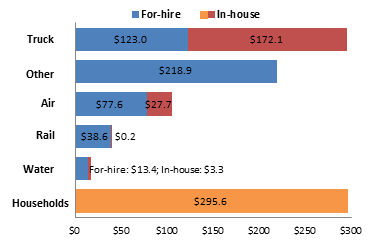
Notes: (a) In-house transportation consists of the services provided by non-transportation industries, including households, for their use. Business in-house transportation consists of the services carried out by non-transportation industries using privately owned and operated vehicles of all body types, used primarily on public rights of way, and the. The dollar value of the business in-house transportation includes the support services to store, maintain, and operate those vehicles. Household transportation covers transportation provided by households for their own use through the use of a motor vehicle. (b) For-hire transportation consists of the services provided by transportation firms to industries and the public on a fee-basis. (c) Other for-hire transportation includes: pipeline, transit and ground passenger transportation, including State and local government passenger transit; sightseeing transportation and transportation support; courier and messenger services; and warehousing and storage. (d) Gross domestic product (GDP) increased from value reported by the Bureau of Economic Analysis in I-O use table by total output from the household production of transportation services.
Source: U.S. Department of Transportation, Bureau of Transportation Statistics, Transportation Satellite Accounts, available at www.bts.gov as of March 2015.
Why is Gross Domestic Product (GDP) larger in the Transportation Satellite Account (TSA) Use Table than in the Input-Output (I-O) Use Table?
See FAQ: What is gross domestic product (GDP)?
What is the amount of transportation used by each industry?
The Use Table shows the amount of each commodity used by an industry during production and by final users. Each column in the Use Table displays the industries and final users that use the commodities. The columns can be thought of as the recipe for producing output. For example, the for-hire truck transportation column in Table 5 shows that the for-hire truck transportation industry required inputs from multiple areas of the economy in order to provide truck transportation services, including $75,269 million of manufacturing products, $3,378 of for-hire truck transportation services, $29,313 million of other for-hire transportation services, and $64,931 million ofother goods and services. In total, the for-hire truck transportation industry needed $172,891 million of commodities ($75,269 + $3,378 + $29,313 + $64,931) to produce transportation services.
For more information, see FAQ: What is the Use Table?
Where can I find the contribution of transportation to the economy as measured by GDP?
The Use Table shows the value each industry adds to GDP. For each industry, there is a row called “value-added” that appears below the rows listing the commodities used by the industry to produce output. Value-added is the income generated by production. More specifically, it is the value of the industry’s sales to other industries and final users less the value of its purchases from other industries[4]. The sum of the value-added by each industry is equal to GDP for the nation. In Table 5, the value added row (outlined in green) shows that the for-hire truck transportation industry contributed $124,017 million to GDP. In-house truck transportation operations contributed $172,093 million and households contributed $129,175 million in owning and operating a personal motor vehicle for their own purposes[5]. GDP is equal to $10,731,981 million and is the sum of the value added by all industries.
For more information, see FAQ: What is the Use Table?
How much transportation does an industry require to produce $1 of output?
The Commodity by Industry Direct Requirements Table shows the amount of each commodity used by an industry to produce a dollar of output. For example, the manufacturing column in Table 6 ) shows that the manufacturing industry required 1¢ (0.0128 *100) of for-hire truck transportation services, 1¢ (0.0122 *100) of other for-hire transportation services, 1¢ (0.0120 *100) of in-house transportation operations, 0.05¢ (0.0005 *100) of other in-house transportation operations to produce one dollar of output. In total, the manufacturing industry required 3.75¢ (0.0128 + 0.0122 + 0.0120 + 0.0005) of transportation services and operations to produce a dollar of output.
For more information, see FAQ: What is the Commodity by Industry Direct Requirements Table?.
How much transportation is required to deliver an additional $1 of a commodity to a final user?
The Commodity by Commodity Direct Requirements Table shows the inputs required to deliver a dollar of a given commodity to final users. The data read down a column. As shown in Table 7, providing one dollar of for-hire transportation services to final users, required 8¢ (0.08 *100) of agriculture and mining products, 46¢ (0.46 *100) of manufacturing products, 14¢ (0.14 *100) of other for-hire transportation services, and 45¢ (0.45 * 100) of products from other industries. In total, every additional dollar of for-hire transportation services provided to final users requires $2.17 of inputs (as shown by the total commodity requirement at the bottom of the for-hire transportation column).
For more information, see FAQ: What is the Commodity by Commodity Direct Requirements Table?.
[1] “Final users” means the purchased goods are not used in the production of another good. In the Use Table, final users are captured in: personal consumption expenditures, private fixed investment, changes in private inventories, net trade, and government consumption expenditures and gross investment.
[2] In the TSA Use Table, value-added is broken into three components: (1) compensation to employees, (2) taxes on production and imports less subsidies, and (3) gross operating surplus.
[3] The value-added by household ownership and operation of a personal motor vehicle is equal to the depreciation of owning and operating a motor vehicle. The time a household spends to operate a personal motor vehicle for personal use is not included, because it is not within the scope of the I-O accounts, upon which the TSAs are built. The I-O accounts, by design, do not include unpaid labor, volunteer work, and other non-market production.
[4] In the TSA Use Table, value-added is broken into three components: (1) compensation to employees, (2) taxes on production and imports less subsidies, and (3) gross operating surplus.
[5] The value-added by household ownership and operation of a personal motor vehicle is equal to the depreciation of owning and operating a motor vehicle. The time a household spends to operate a personal motor vehicle for personal use is not included, because it is not within the scope of the I-O accounts, upon which the TSAs are built. The I-O accounts, by design, do not include unpaid labor, volunteer work, and other non-market production.
