
National Transportation Statistics
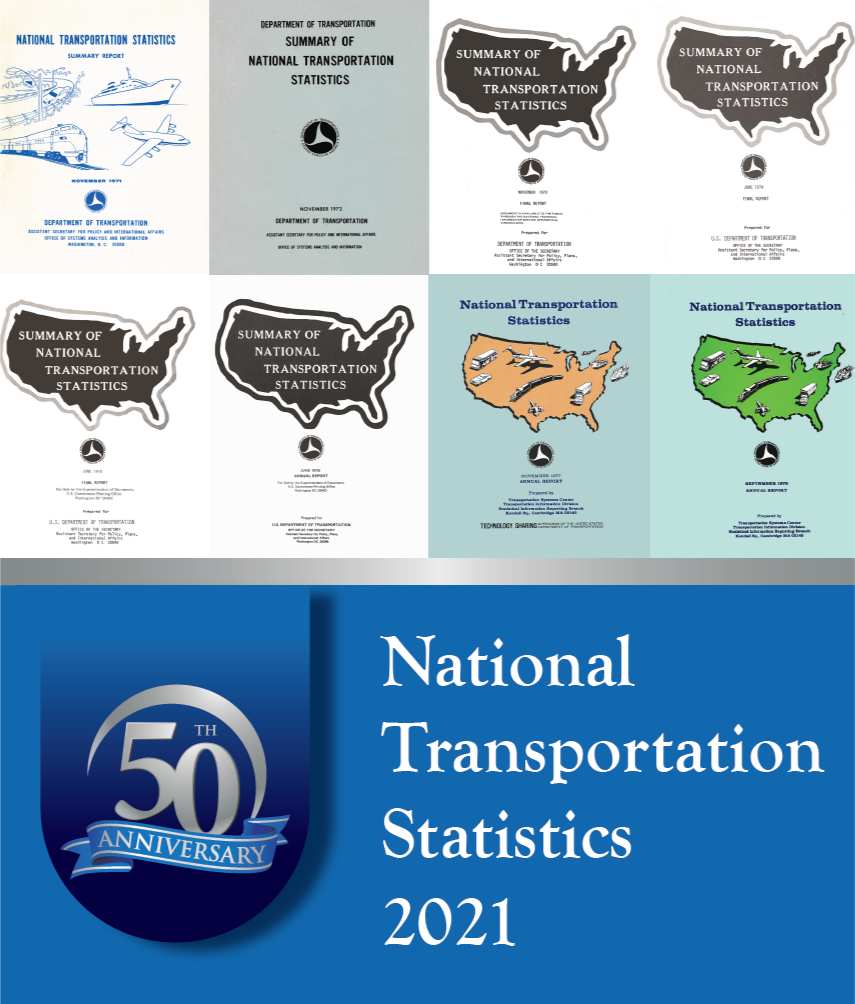 The National Transportation Statistics (NTS) is a collection of transportation data first published in November 1971.
Recently Updated Tables by Topic:
- U.S. Oil and Gas Pipeline Mileage (1-10)
- Active U.S. Air Carrier and General Aviation Fleet by Type of Aircraft (1-13)
- Transportation Fatalities by Mode (2-1)
- Injured Persons by Transportation Mode (2-2)
- Motor Vehicle Safety Data (2-17)
- Motor Vehicle Fatalities, Vehicle-Miles, and Associated Rates by Highway Functional System (2-18)
- Occupant Fatalities by Vehicle Type and Nonoccupant Fatalities (2-19)
- Occupant and Non-Motorist Fatalities in Crashes by Number of Vehicles and Alcohol Involvement (2-20)
- Waterborne Transportation Safety and Property Damage Data Related to Vessel Casualties (2-45)
- Waterborne Transportation Safety Data not Related to Vessel Casualties (2-46)
- Employment in For-Hire Transportation and Selected Transportation-Related Industries (3-23)
- Certificated Air Carrier Fuel Consumption and Travel (4-8, 4-8M)
- Energy Intensity of Passenger Modes (4-20, 4-20M)
- Annual Wasted Fuel Due to Congestion (4-28)
- Annual Wasted Fuel Per Person (4-29)
- Areas in Nonattainment of National Ambient Air Quality Standards for Criteria Pollutants (4-52)
- U.S. Carbon Dioxide Emissions from Energy Use by Sector (4-53)
- Leaking Underground Storage Tank Releases and Cleanups (4-55)
- Highway Noise Barrier Construction (4-56)
- Table 1-1 - System Mileage Within the United States (statute miles)
- Table 1-2 - Number of Air Carriers, Railroads, Interstate Motor Carriers, Marine Vessel Operators, and Pipeline Operators
- Table 1-3 - Number of U.S. Airports
- Table 1-4 - Public Road and Street Mileage in the United States by Type of Surface
- Table 1-5 - Public Road and Street Mileage in the United States by Functional System
- Table 1-6a - Estimated U.S. Roadway Lane-Miles by Functional System
- Table 1-6b - Number of U.S. Public and Private Alternative Fueling Stations by Fuel Type
- Table 1-7 - Number of Stations Served by Amtrak and Rail Transit, Fiscal Year
- Table 1-8 - ADA Lift- or Ramp-Equipped Transit Buses
- Table 1-9 - ADA-Accessible Rail Transit Stations by Agency
- Table 1-10 - U.S. Oil and Gas Pipeline Mileage
- Table 1-11 - Number of U.S. Aircraft, Vehicles, Vessels, and Other Conveyances
- Table 1-12 - U.S. Sales or Deliveries of New Aircraft, Vehicles, Vessels, and Other Conveyances
- Table 1-13 - Active U.S. Air Carrier and General Aviation Fleet by Type of Aircraft
- Table 1-14 - U.S. Automobile and Truck Fleets by Use
- Table 1-15 - Annual U.S. Motor Vehicle Production and Domestic Sales
- Table 1-16 - Retail New Passenger Car Sales
- Table 1-17a - New and Used Passenger Car and Light Truck Sales and Leases
- Table 1-17b - New Car and Light Truck Sales by Levels of Driving Automation
- Table 1-18 - Retail Sales of New Cars by Sector
- Table 1-19 - Hybrid-Electric, Plug-in Hybrid-Electric and Electric Vehicle Sales
- Table 1-20 - Productions, Production Shares, and Production-Weighted Fuel Economies of New Domestic and Imported Automobiles
- Table 1-21: Number of U.S. On-Road Motorcycles Registrations by type
- Table 1-22a - Number of Trucks by Weight
- Table 1-22b - Number of U.S. Truck Registrations by Type
- Table 1-23 - World Motor Vehicle Production, Selected Countries
- Table 1-24 - Number and Size of the U.S. Flag Merchant Fleet and Its Share of the World Fleet
- Table 1-25 - U.S. Airport Runway Pavement Conditions
- Table 1-26 - Average Age of Automobiles and Trucks in Operation in the United States
- Table 1-27 - Condition of U.S. Roadways by Functional System
- Table 1-28a - Condition of U.S. Highway Bridges
- Table 1-28b - Condition of U.S. Highway Bridges with Navigation Vertical Clearance Greater Than Zero
- Table 1-29 - Average Age of Urban Transit Vehicles
- Table 1-30 - Condition of Urban Bus and Rail Transit Maintenance Facilities
- Table 1-31 - Condition of Rail Transit Infrastructure
- Table 1-32 - Class I Railroad Locomotive Fleet by Year Built
- Table 1-33 - Age and Availability of Amtrak Locomotive and Car Fleets
- Table 1-34 - U.S. Flag Vessels by Type and Age
- Table 1-35 - U.S. Vehicle-Miles
- Table 1-36 - Roadway Vehicle-Miles Traveled (VMT) and VMT per Lane-Mile by Functional System
- Table 1-37 - U.S. Air Carrier Aircraft Departures, Enplaned Revenue Passengers, and Enplaned Revenue Tons
- Table 1-38 - Average Length of Haul, Domestic Freight and Passenger Modes
- Table 1-39 - Worldwide Commercial Space Launches
- Table 1-40 - U.S. Passenger-Miles
- Table 1-41 - Principal Means of Transportation to Work
- Table 1-42 - Average Annual PMT, VMT Person Trips and Trip Length by Trip Purpose
- Table 1-43 - Summary Statistics on Demographic Characteristics and Total Travel
- Table 1-44 - Passengers Boarded at the Top 50 U.S. Airports
- Table 1-45 - Air Passenger Travel Arrivals in the United States from Selected Foreign Countries
- Table 1-46 - Air Passenger Travel Departures from the United States to Selected Foreign Countries
- Table 1-47 - U.S.-Canadian Border Land-Passenger Gateways: Entering the United States
- Table 1-48 - U.S.-Mexican Border Land-Passenger Gateways: Entering the United States
- Table 1-49 - Table has been discontinued
- Table 1-50 - U.S. Ton-Miles of Freight
- Table 1-51 - Top U.S. Foreign Trade Freight Gateways by Value of Shipments
- Table 1-52 - U.S.-Canadian Border Land-Freight Gateways: Number of Incoming Truck or Rail Container Crossings
- Table 1-53 - U.S.-Canadian Border Land-Freight Gateways: Number of Incoming Truck or Train Crossings
- Table 1-54 - U.S.-Mexican Border Land-Freight Gateways: Number of Incoming Truck or Rail Container Crossings
- Table 1-55 - U.S.-Mexican Border Land-Freight Gateways: Number of Incoming Truck and Train Crossings
- Table 1-56 - U.S. Waterborne Freight
- Table 1-57 - Tonnage of Top 50 U.S. Water Ports, Ranked by Total Tons
- Table 1-58 - Freight Activity in the United States
- Table 1-59 - Value and Tons of Freight Shipments within the United States by Domestic Establishments
- Table 1-60a - Value of U.S. Exports to and Imports from Canada and Mexico by Transportation Mode
- Table 1-60b - Weight of U.S. Exports to and Imports from Canada and Mexico by Transportation Mode
- Table 1-61 - Crude Oil and Petroleum Products Transported in the United States by Mode
- Table 1-62 - U.S. Hazardous Materials Shipments by Transportation Mode
- Table 1-63 - U.S. Hazardous Materials Shipments by Hazard Class
- Table 1-64 - Passengers Boarded and Denied Boarding by the Largest U.S. Air Carriers
- Table 1-65 - Baggage Mishandled by Marketing U.S. Air Carriers
- Table 1-66 - Flight Operations Arriving On Time by the Largest U.S. Air Carriers
- Table 1-67 - FAA-Cited Causes of Departure and En Route Delays (after pushing back from the gate)
- Table 1-68 - Major U.S. Air Carrier Delays, Cancellations, and Diversions
- Table 1-69 - Annual Person-Hours of Highway Traffic Delay per Person
- Table 1-70 - Travel Time Index
- Table 1-71 - Annual Roadway Congestion Index
- Table 1-72 - Annual Highway Congestion Cost
- Table 1-73 - Amtrak On-Time Performance Trends and Hours of Delay by Cause
- Table 2-1 - Transportation Fatalities by Mode
- Table 2-2 - Injured Persons by Transportation Mode
- Table 2-3 - Transportation Accidents by Mode
- Table 2-4 - Distribution of Transportation Fatalities by Mode
- Table 2-5 - Highway-Rail Grade-Crossing Safety
- Table 2-6 - Hazardous Materials Fatalities, Injuries, Accidents, and Property Damage Data
- Table 2-7 - Transportation-Related Occupational Fatalities
- Table 2-8 - Reporting Thresholds for Property Damage by U.S. Department of Transportation Modal Administrations
- Table 2-9 - U.S. Air Carrier Safety Data
- Table 2-10 - U.S. Commuter Air Carrier Safety Data
- Table 2-11 - U.S. Air Carrier Fatal Accidents by Defining Event of Operation
- Table 2-12 - U.S. Commuter Air Carrier Fatal Accidents by Defining Event of Operation
- Table 2-13 - U.S. On-Demand Air Taxi Safety Data
- Table 2-14 - U.S. General Aviation Safety Data
- Table 2-15 - Number of Pilot-Reported Near Midair Collisions (NMAC) by Degree of Hazard
- Table 2-16 - Prohibited Items Intercepted at Airport Screening Checkpoints
- Table 2-17 - Motor Vehicle Safety Data
- Table 2-18 - Motor Vehicle Fatalities, Vehicle-Miles, and Associated Rates by Highway Functional System
- Table 2-19 - Occupant Fatalities by Vehicle Type and Nonoccupant Fatalities
- Table 2-20 - Occupant and Non-Motorist Fatalities in Crashes by Number of Vehicles and Alcohol Involvement
- Table 2-21a - Passenger Car Occupant Safety Data
- Table 2-21b - Work Zone Safety Data
- Table 2-22 - Motorcycle Rider Safety Data
- Table 2-23 - Truck Occupant Safety Data
- Table 2-24 - Bus Occupant Safety Data
- Table 2-25 - State Laws on Distracted Driving - Ban on Hand-Held Devices and Texting While Driving
- Table 2-26 - Fatalities by Highest Blood Alcohol Concentration (BAC) in Highway Crashes
- Table 2-27 - Number of States with Different Types of Anti-DUI/DWI Legislation in Effect as of January 1 of the Listed Year
- Table 2-28 - Motor Vehicle Fatal Crashes by Day of Week, Time of Day, and Weather and Light Conditions
- Table 2-29 - Motor Vehicles and Occupants Involved in Fatal Crashes by Posted Speed Limit
- Table 2-30 - Safety Belt and Motorcycle Helmet Use
- Table 2-31 - Estimated Number of Lives Saved by Occupant Protection, Motorcycle Helmets, and Drinking Age Law
- Table 2-32 - Transit Safety and Property Damage Data
- Table 2-33 - Transit Safety Data by Mode for All Reported Accidents
- Table 2-34 - Transit Safety Data by Mode for All Reported Incidents
- Table 2-35 - Transit and Grade-Crossing Fatalities by Rail Transit Mode
- Table 2-36 - Transit and Grade-Crossing Injuries by Rail Transit Mode
- Table 2-37 - Transit and Grade-Crossing Incidents by Rail Transit Mode
- Table 2-38 - Security Events of Crime by Transit Mode
- Table 2-39 - Railroad and Grade-Crossing Fatalities by Victim Class
- Table 2-40 - Railroad and Grade-Crossing Injured Persons by Victim Class
- Table 2-41 - Train Fatalities, Injuries, and Accidents by Type of Accident
- Table 2-42 - Railroad Passenger Safety Data
- Table 2-43 - Railroad System Safety and Property Damage Data
- Table 2-44 - Fatalities and Injuries of On-Duty Railroad Employees
- Table 2-45 - Waterborne Transportation Safety and Property Damage Data Related to Vessel Casualties
- Table 2-46 - Waterborne Transportation Safety Data not Related to Vessel Casualties
- Table 2-47 - Recreational Boating Safety, Alcohol Involvement, and Property Damage Data
- Table 2-48 - Personal Watercraft Safety Data
- Table 2-49 - U.S. Coast Guard Search and Rescue Statistics
- Table 3-1 - U.S. Gross Domestic Product (GDP) Attributed to For-Hire Transportation Services (current dollars)
- Table 3-2 - U.S. Gross Domestic Product (GDP) Attributed to For-Hire Transportation Services (chained 2017 dollars)
- Table 3-3 - U.S. Gross Domestic Product (GDP) Attributed to Transportation Functions (current dollars)
- Table 3-4 - U.S. Gross Domestic Product (GDP) Attributed to Transportation Functions (chained 2017 dollars)
- Table 3-5 - Table has been discontinued
- Table 3-6 - Table has been discontinued
- Table 3-7 - Contributions to U.S. Gross Domestic Product (GDP): Selected Industries (current dollars)
- Table 3-8 - Contributions to U.S. Gross Domestic Product (GDP): Selected Industries (chained 2017 dollars)
- Table 3-9 - U.S. Gross Domestic Product (GDP) by Major Social Function (current dollars)
- Table 3-10 - U.S. Transportation and Economic Trends
- Table 3-11 - Sales Price of Transportation Fuel to End-Users
- Table 3-12 - Price Trends of Gasoline v. Other Consumer Goods and Services
- Table 3-13 - Producer Price Indices for Transportation Services and Warehousing Services (NAICS)
- Table 3-14 - Producer Price Indices for Transportation Equipment (NAICS)
- Table 3-15 - Personal Expenditures by Category (millions of current dollars)
- Table 3-16 - Personal Consumption Expenditures on Transportation by Subcategory
- Table 3-17 - Average Cost of Owning and Operating an Automobile
- Table 3-18 - Average Passenger Fares (current dollars)
- Table 3-19 - Average Passenger Fares (chained 2017 dollars)
- Table 3-20 - Average Passenger Revenue per Passenger-Mile
- Table 3-21 - Average Freight Revenue per Ton-Mile
- Table 3-22 - Total Operating Revenues
- Table 3-23 - Employment in For-Hire Transportation and Selected Transportation-Related Industries (NAICS)
- Table 3-24 - Employment in Transportation and Transportation-Related Occupations
- Table 3-25 - Average Wage and Salary Accruals per Full-Time Equivalent Employee by Transportation Industry (NAICS)
- Table 3-26 - Median Weekly Earnings of Full-Time Wage and Salary Workers in Transportation by Detailed Occupation (SOC)
- Table 3-27 - Total Wage and Salary Accruals by Transportation Industry (NAICS)
- Table 3-28 - Labor Productivity Indices for Selected Transportation Industries (NAICS)
- Table 3-29 - Federal, State, and Local Government Transportation-Related Revenues and Expenditures, Fiscal Year (current dollars)
- Table 3-30 - Federal, State, and Local Government Transportation-Related Revenues and Expenditures, Fiscal Year (chained 2017 dollars)
- Table 3-31 - Summary of Transportation Revenues and Expenditures from Own Funds and User Coverage, Fiscal Year
- Table 3-32 - Transportation Revenues by Level of Government and Mode, Fiscal Year (current dollars)
- Table 3-33 - Transportation Revenues by Level of Government and Mode, Fiscal Year (chained 2017 dollars)
- Table 3-34 - Cash Balances of the Transportation-Related Federal Trust Funds, Fiscal Year
- Table 3:35 - Transportation Expenditures by Level of Government and Mode From Own Funds, Fiscal Year (current dollars)
- Table 3:36 - Transportation Expenditures by Level of Government and Mode From Own Funds, Fiscal Year (chained 2017 dollars)
- Table 3:37 - Federal Transportation Transfers to State and Local Governments by Mode, Fiscal Year (current dollars)
- Table 3:38 - Federal Transportation Transfers to State and Local Governments by Mode, Fiscal Year (chained 2017 dollars)
- Table 4-4 - U.S. Energy Consumption by the Transportation Sector
- Table 4-5 - Fuel Consumption by Mode of Transportation in Physical Units
- Table 4-6 - Energy Consumption by Mode of Transportation
- Table 4-7 - Domestic Demand for Gasoline by Mode
- Table 4-8 - Certificated Air Carrier Fuel Consumption and Travel
- Table 4-9 - Motor Vehicle Fuel Consumption and Travel
- Table 4-10 - Estimated Consumption of Alternative and Replacement Fuels for Highway Vehicles
- Table 4-11 - Light Duty Vehicle, Short Wheel Base and Motorcycle Fuel Consumption and Travel
- Table 4-12 - Light Duty Vehicle, Long Wheel Base Fuel Consumption and Travel
- Table 4-13 - Single-Unit 2-Axle 6-Tire or More Truck Fuel Consumption and Travel
- Table 4-14 - Combination Truck Fuel Consumption and Travel
- Table 4-15 - Bus Fuel Consumption and Travel
- Table 4-16 - Transit Industry Electric Power and Primary Energy Consumption and Travel
- Table 4-17 - Class I Rail Freight Fuel Consumption and Travel
- Table 4-18 - Amtrak Fuel Consumption and Travel
- Table 4-19 - U.S. Government Energy Consumption by Agency and Source
- Table 4-20 - Energy Intensity of Passenger Modes
- Table 4-21 - Energy Intensity of Certificated Air Carriers, All Services
- Table 4-22 - Energy Intensity of Light Duty Vehicles and Motorcycles
- Table 4-23 - Average Fuel Efficiency of U.S. Light Duty Vehicles
- Table 4-24 - Energy Intensity of Transit Motor Buses
- Table 4-25 - Energy Intensity of Class I Railroad Freight Service
- Table 4-26 - Energy Intensity of Amtrak Services
- Table 4-27 - Energy Intensity of Amtrak Services (loss-adjusted conversion factors)
- Table 4-28 - Annual Wasted Fuel Due to Congestion
- Table 4-29 - Annual Wasted Fuel per Person
- Table 4-30 - Federal Exhaust Emission Certification Standards for Newly Manufactured Gasoline- and Diesel-Powered Light-Duty Vehicles
- Table 4-31 - Federal Exhaust Emission Certification Standards for Newly Manufactured Gasoline- and Diesel-Powered Light Duty Trucks (category LDT1)
- Table 4-32 - Federal Exhaust Emission Certification Standards for Newly Manufactured Gasoline- and Diesel-Powered Light Duty Trucks (category LDT2)
- Table 4-33 - Federal Exhaust Emission Certification Standards for Newly Manufactured Gasoline- and Diesel-Powered Light Duty Trucks (category LDT3)
- Table 4-34 - Federal Exhaust Emission Certification Standards for Newly Manufactured Gasoline- and Diesel-Powered Light Duty Trucks (category LDT4)
- Table 4-35 - Federal Exhaust Emission Certification Standards for Newly Manufactured Gasoline- and Diesel-Powered Medium-Duty Passenger Vehicles (MDPV)
- Table 4-36 - Federal Exhaust Emissions Certification Standards for Newly Manufactured Gasoline- and Diesel-Powered Light Heavy-Duty Trucks
- Table 4-37 - Federal Exhaust Emissions Certification Standards for Newly Manufactured Gasoline- and Diesel-Powered Heavy Heavy-Duty Trucks
- Table 4-38 - Federal Exhaust Emissions Standards for Newly Manufactured Motorcycles
- Table 4-39 - Federal Exhaust Emissions Standards for Newly Manufactured and In-Use Aircraft Engines
- Table 4-40 - Federal Exhaust Emissions Standards for Locomotives
- Table 4-41 - Federal Exhaust Emissions Standards for Marine Spark-Ignition Engines and Vehicles
- Table 4-42 - Tier 2 Federal Exhaust Emissions Standards for Newly Manufactured Commercial Marine Compression-Ignition Engines
- Table 4-43 - Estimated U.S. Average Vehicle Emissions Rates per Vehicle by Vehicle Type Using Gasoline, Diesel, and Electric
- Table 4-44 - Transportation-Related Greenhouse Gas Emissions
- Table 4-45 - Estimated U.S. Emissions of Carbon Monoxide
- Table 4-46 - Estimated U.S. Emissions of Nitrogen Oxides
- Table 4-47 - Estimated U.S. Emissions of Volatile Organic Compounds
- Table 4-48 - Estimated U.S. Emissions of Particulate Matter (PM-10)
- Table 4-49 - Estimated U.S. Emissions of Particulate Matter (PM-2.5)
- Table 4-50 - Estimated U.S. Emissions of Sulfur Dioxide
- Table 4-51 - Air Pollution Trends in Selected Metropolitan Statistical Areas
- Table 4-52 - Areas in Nonattainment of U.S. Ambient Air Quality Standards for Criteria Pollutants
- Table 4-53 - U.S. Carbon Dioxide Emissions from Energy Use by Sector
- Table 4-54 - Petroleum Oil Spills Impacting Navigable U.S. Waters
- Table 4-55 - Leaking Underground Storage Tank Releases and Cleanups
- Table 4-56 - Highway Noise Barrier Construction
- Table 4-57 - Number of People Residing in Areas of Significant Noise Exposure Around U.S. Airports
- Table 4-58 - Motor Vehicles Scrapped
- Table 1-1M - System Kilometers Within the United States
- Table 1-4M - Public Roads and Streets in the United States by Type of Surface
- Table 1-6M - Estimated U.S. Roadway Lane-Kilometers by Functional System
- Table 1-35M - U.S. Vehicle-Kilometers
- Table 1-36M - Roadway Vehicle-Kilometers Traveled (VKT) and VKT per Lane-Kilometers by Functional Class
- Table 1-38M - Average Length of Haul, Domestic Freight and Passenger Modes
- Table 1-40M - U.S. Passenger-Kilometers
- Table 1-49M - Table has been discontinued
- Table 1-50M - U.S. Tonne-Kilometers of Freight
- Table 1-56M - U.S. Waterborne Freight
- Table 1-61M - Table has been discontinued
- Table 4-2M - U.S. Consumption of Energy from Primary Sources by Sector
- Table 4-3M - Domestic Demand for Refined Petroleum Products by Sector
- Table 4-4M - U.S. Energy Consumption by the Transportation Sector
- Table 4-5M - Fuel Consumption by Mode of Transportation
- Table 4-6M - Energy Consumption by Mode of Transportation
- Table 4-7M - Domestic Demand for Gasoline by Mode
- Table 4-8M - Certificated Air Carrier Fuel Consumption and Travel
- Table 4-9M - Motor Vehicle Fuel Consumption and Travel
- Table 4-11M - Light Duty Vehicle, Short Wheel Base and Motorcycle Fuel Consumption and Travel
- Table 4-12M - Light Duty Vehicle, Long Wheel Base Fuel Consumption and Travel
- Table 4-13M - Single-Unit 2-Axle 6-Tire or More Truck Fuel Consumption and Travel
- Table 4-14M - Combination Truck Fuel Consumption and Travel
- Table 4-15M - Bus Fuel Consumption and Travel
- Table 4-16M - Transit Industry Electric Power and Primary Energy Consumption and Travel
- Table 4-17M - Class I Rail Freight Fuel Consumption and Travel
- Table 4-18M - Amtrak Fuel Consumption and Travel
- Table 4-19M - U.S. Government Energy Consumption by Agency and Source
- Table 4-20M - Energy Intensity of Passenger Modes
- Table 4-21M - Energy Intensity of Certificated Air Carriers, All Services
- Table 4-22M - Energy Intensity of Light Duty Vehicles and Motorcycles
- Table 4-23M - Average Fuel Efficiency of U.S. Light Duty Vehicles
- Table 4-24M - Energy Intensity of Transit Motor Buses
- Table 4-25M - Energy Intensity of Class I Railroad Freight Service