


Freight Analysis Framework
Query and Visualize Commodity Flow Estimates
Use the FAF6 Data Tabulation Tool to create custom tables and visualizations based on the latest version of FAF6.
About the Freight Analysis Framework
The Freight Analysis Framework (FAF) database provides estimates of US freight flows. The FAF provides data for states and metropolitan areas. Flows include all modes of transportation and 42 commodity types. The Bureau of Transportation Statistics (BTS) produces the FAF using data from many sources. Inputs include the Commodity Flow Survey (CFS), foreign trade data, and data from agriculture, extraction, utility, construction, service, and other sectors.
The latest version of FAF (FAF 6) provides estimates of weight and value by origin and destination regions, commodity type, and mode for the base year (2022). FAF6 provides weight in thousands of tons and value in millions of 2022 constant dollars. Users can download .csv and Microsoft (MS) Access files below.
Update: FAF 6 is now available. FAF 6 is the new benchmark of estimated U.S. commodity flows based on 2022 data. The User's Guide has been updated. Other documentation is currently being updated. The Frequently Asked Questions (FAQs) page has a new section on limitations of FAF (www.bts.gov/faf/faqs).
Regional database of tonnage and value by origin-destination pair, commodity type, and mode.
- FAF6.0 Regional database for 2022 [MS Access 34MB] [CSV 20MB]
State database of tonnage and value by origin-destination pair, commodity type, and mode.
- FAF6.0 State database for 2022 [MS Access 11MB] [CSV 7MB]
- FAF6 citation:
- U.S. Department of Transportation, Bureau of Transportation Statistics (BTS). (2022) Freight Analysis Framework, FAF6 [datasets]. https://doi.org/10.21949/fhgm-g335
- FAF5 citation for 2017-2050 data:
- U.S. Department of Transportation, Bureau of Transportation Statistics (BTS), Federal Highway Administration (FHWA). (2017) Freight Analysis Framework, FAF5 [datasets]. https://doi.org/10.21949/1529116
- FAF5 citation for historical reprocessed 1997-2012 data:
- U.S. Department of Transportation, Bureau of Transportation Statistics (BTS), Federal Highway Administration (FHWA). (2017) Freight Analysis Framework, FAF5 [datasets]. https://doi.org/10.21949/1529108
- FAF4 citation:
- U.S. Department of Transportation, Bureau of Transportation Statistics (BTS), Federal Highway Administration (FHWA). (2012) Freight Analysis Framework, FAF4 [datasets].
- FAF1 to FAF3 citation:
- U.S. Department of Transportation, Federal Highway Administration (FHWA). (1997-2007) Freight Analysis Framework, FAF-1-3 [datasets].
Previous Versions
Read about previous FAF5 versions and FAF's version numbering. Also view FAF5 data and documentation and FAF4 data and documentation.
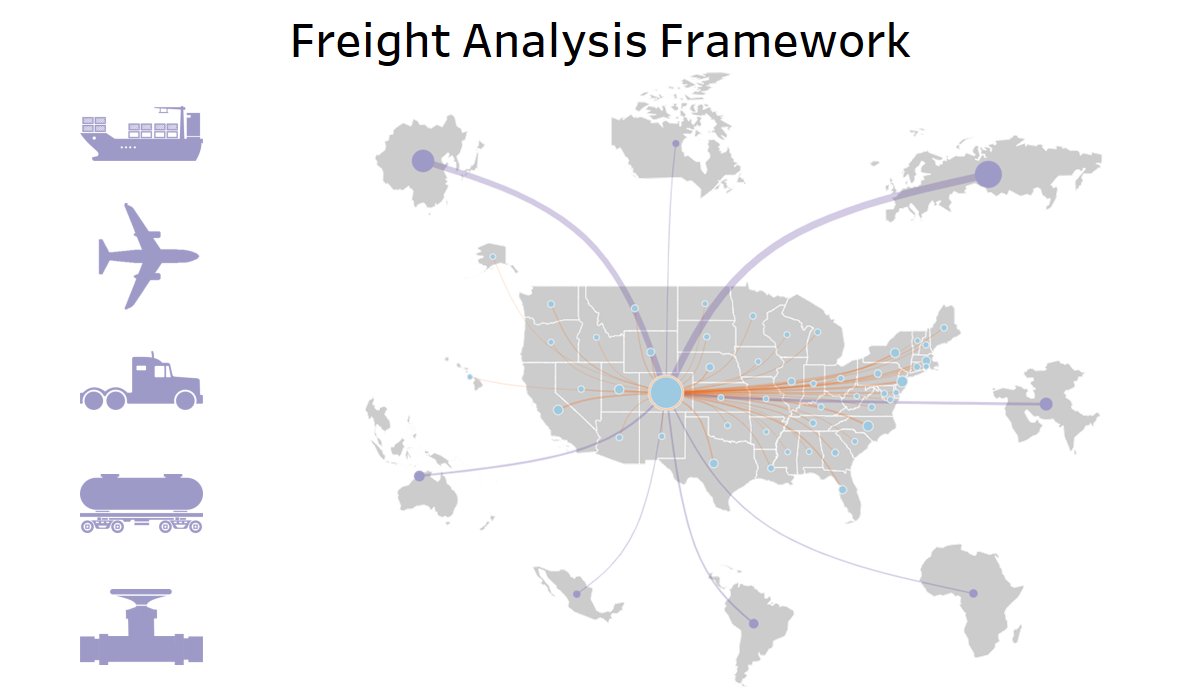
The Freight Analysis Framework (FAF) creates a comprehensive picture of freight movement among states and major metropolitan areas by all modes of transportation. The FAF integrates data from a variety of sources. Starting with data from the Commodity Flow Survey (CFS) and international trade data from the Census Bureau, FAF incorporates data from agriculture, extraction, utility, construction, service, and other sectors. The FAF data is produced and managed by the Bureau of Transportation Statistics (BTS).
The current version of FAF6 (FAF6.0) provides estimates for tonnage (unit: thousand tons) and value (unit: million dollars) by origin-destination pair of FAF regions, commodity type, and mode for the base year (2022). The information may be accessed through the Data Tabulation Tool and downloaded as either a complete database or in summary files.