
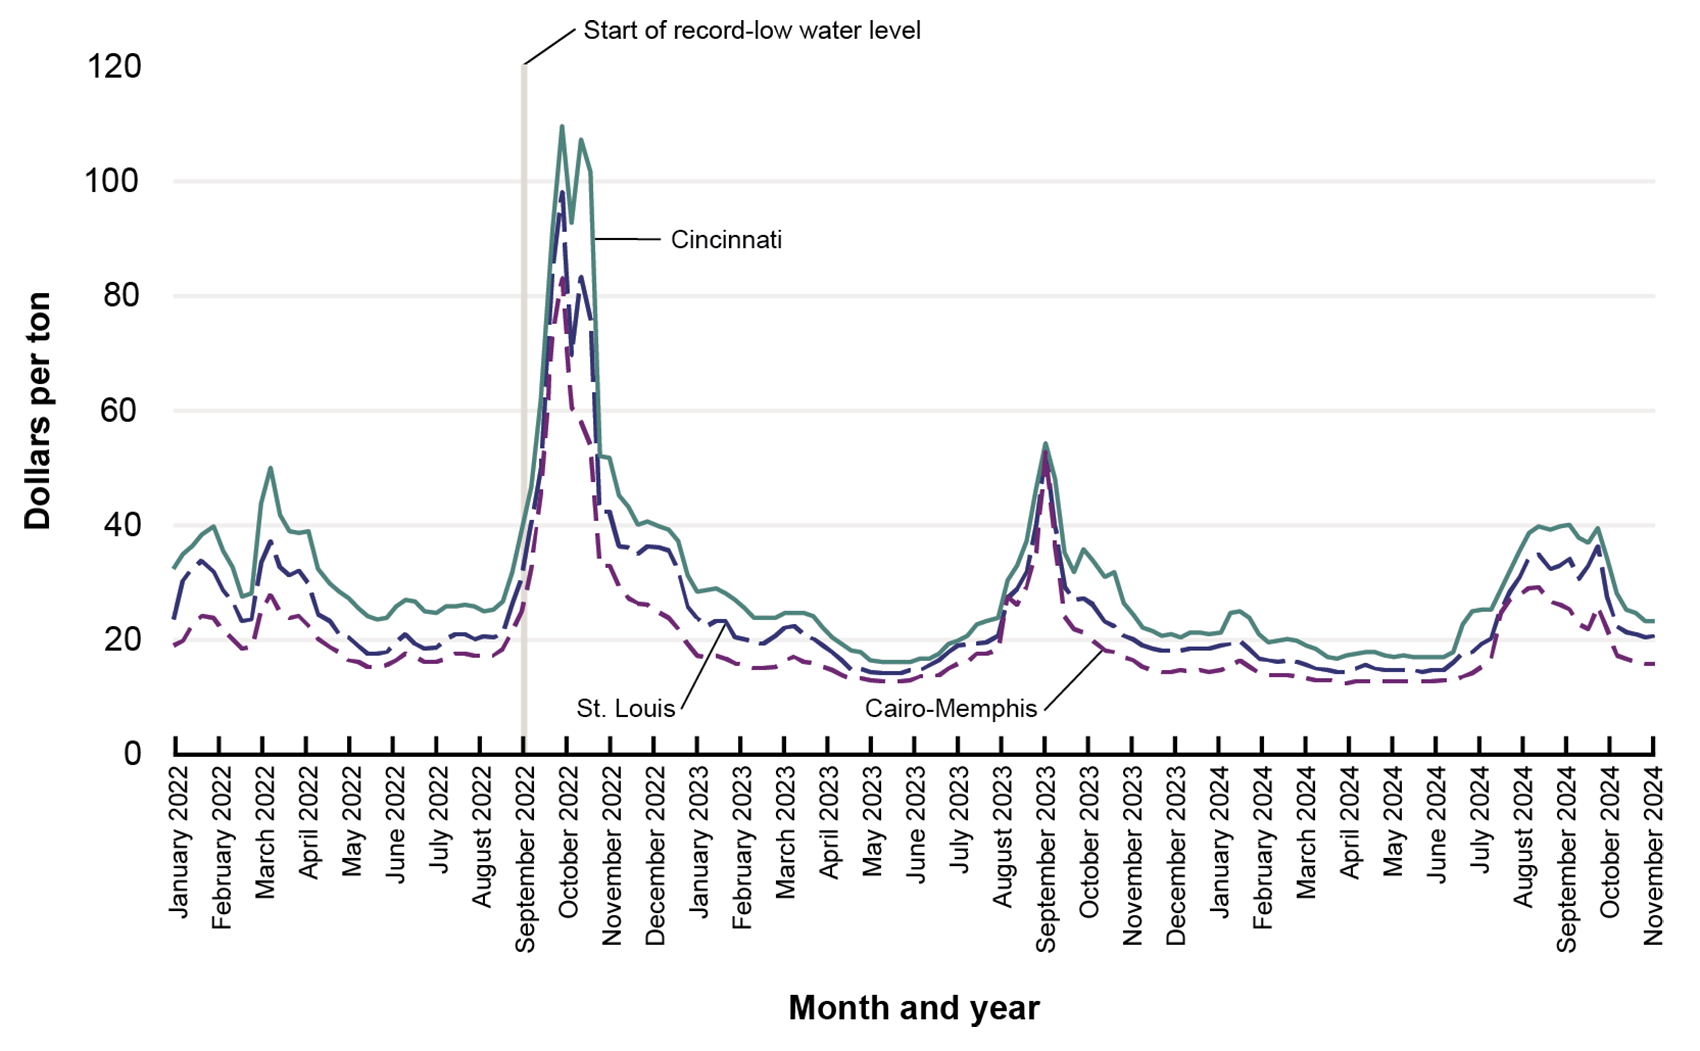
Weekly Downbound Grain Barge Rates: Jan 2019-Dec 2024
Figure
Dataset Excel:
F1-24 Grain Barge Rates new.xlsx (113.64 KB)Description:
This graph is from the 2024 Transportation Statistics Annual Report
Source:
U.S. Department of Transportation, Bureau of Transportation Statistics, analysis based upon Downbound Grain Barge Rates (12/01/24), Latest Supply Chain Indicators, available at http://www.bts.gov as of December 2024.Note: Weekly barge rates for downbound freight originating from seven locations along the Mississippi River System, which includes the Mississippi River and its tributaries (e.g., Upper Mississippi River, Illinois River, Ohio River). Shown are St. Louis; Cincinnati, along the middle third of the Ohio River; and Cairo-Memphis from Cairo, IL, to Memphis, TN. Low water tends to happen in the late summer to early fall months.
Previous Editions:
Publications: