
Information about the Port of Baltimore
Data spotlights represent data and statistics from a specific period of time, and do not reflect ongoing data collection. As individual spotlights are static stories, they are not subject to the Bureau of Transportation Statistics (BTS) web standards and may not be updated after their publication date. Please contact BTS to request updated information.
In response to the Francis Scott Key Bridge collapse on the morning of March 26, 2024, the Bureau of Transportation Statistics (BTS) provides the following information:
- The Port of Baltimore is among the top 20 ports in the United States by tonnage and number of containers handled, is 10th largest port for dry bulk, and is a major hub for the import and export of motorized vehicles.
- As of 4pm on March 27, vessel tracking data show 3 bulk carriers, 2 general cargo ships, 1 vehicles carrier, 1 tanker, 4 Maritime Administration (MARAD) Ready Reserve Force vessels, and the container ship "DALI" behind the fallen bridge in the Baltimore harbor. There is 1 vehicles carrier in the port beyond the bridge. There are 9 bulk carriers, 1 vehicles carrier, and 2 general cargo vessels at anchorage beyond the bridge.
- At least two cruise ships, one of which has a capacity of more than 2,000 passengers and more than 700 crew are scheduled to return to Baltimore. Many people will need to be reunited with their motor vehicles parked at the terminal in the harbor.
- The Francis Scott Key Bridge carried 12.5 million vehicles in 2023, averaging more than 34,000 vehicles a day over the year. This is 15 percent of the total traffic for all 3 harbor crossings, and the diverted traffic would add 18 percent to the combined volumes for the Fort McHenry and Harbor Tunnels.
- Trucks that carry hazardous cargo, which are not allowed in the I-95 and I-895 tunnels, and use I-695 to pass through the Baltimore region. The shorter route on I-695 is over the Key Bridge and is 24.3 miles around the eastern and southern sides of Baltimore. The longer route on I-695 is 27.5 miles around the northern and western sides of the Baltimore beltway rather than the 24.3 mile route around the eastern and southern sides of Baltimore and is more frequently congested. Population exposure is increased from over 38,000 people live within 1/2 mile of the shorter route to more than 100,000 people live within 1/2 mile of the longer route. The longer route is also more affected by peak period congestion.
- Take a look at the port profile for Baltimore.
- Explore the tabulations of the tonnage and value of commodities that move through the Port of Baltimore from the Freight Analysis Framework.
- Explore tabulations of the value of imports and exports by Harmonized System code for the Port of Baltimore from US foreign trade statistics
Take a closer look at the map below.
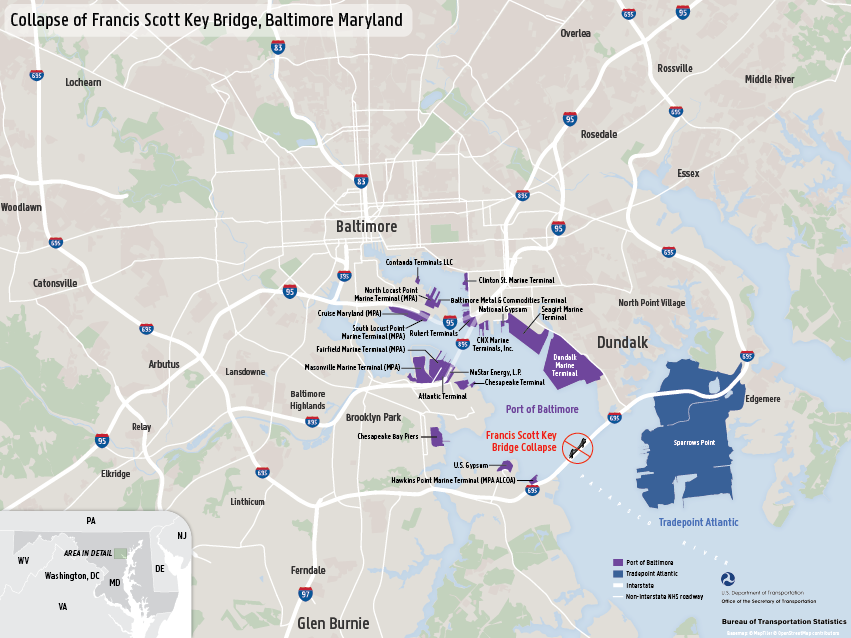
Sources: Vessel location information is from the USDOT Volpe Center SeaVision system. Vehicle counts are from the Maryland Transportation Authority FY 2024 Traffic and Toll Revenue Forecast Update, November 3, 2023. The map, statistics on hazardous cargo routes, and tabulations of the Freight Analysis Framework are by the Bureau of Transportation Statistics.
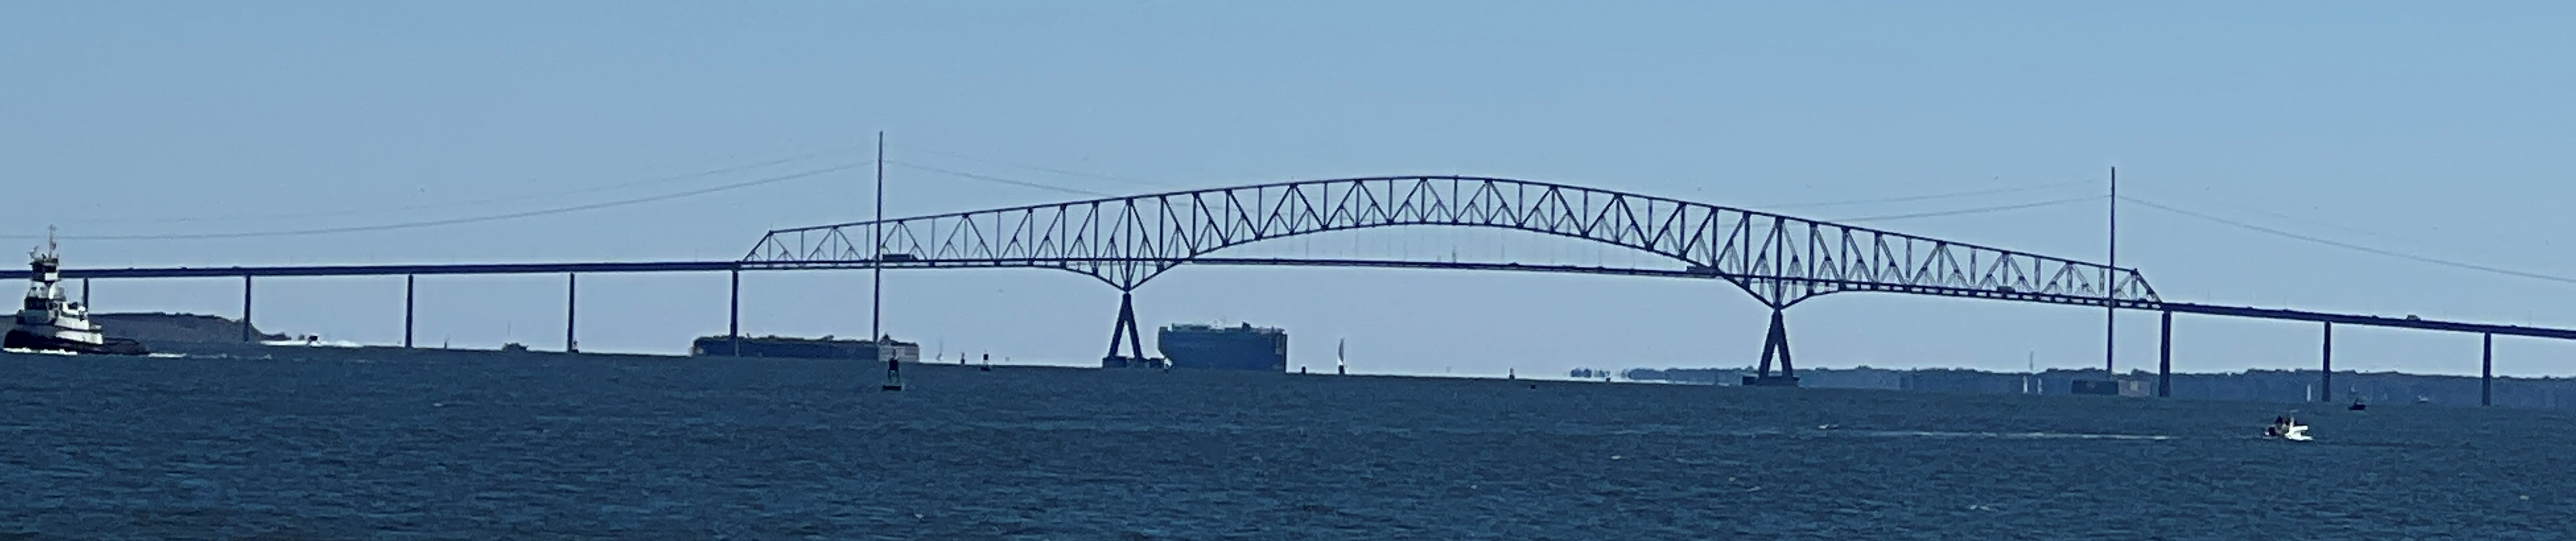
Francis Scott Key Bridge with departing roll-on roll-off ship just beyond the bridge, taken from Fort McHenry on October 9, 2022.
Source: Rolf Schmitt, Deputy Director, BTS
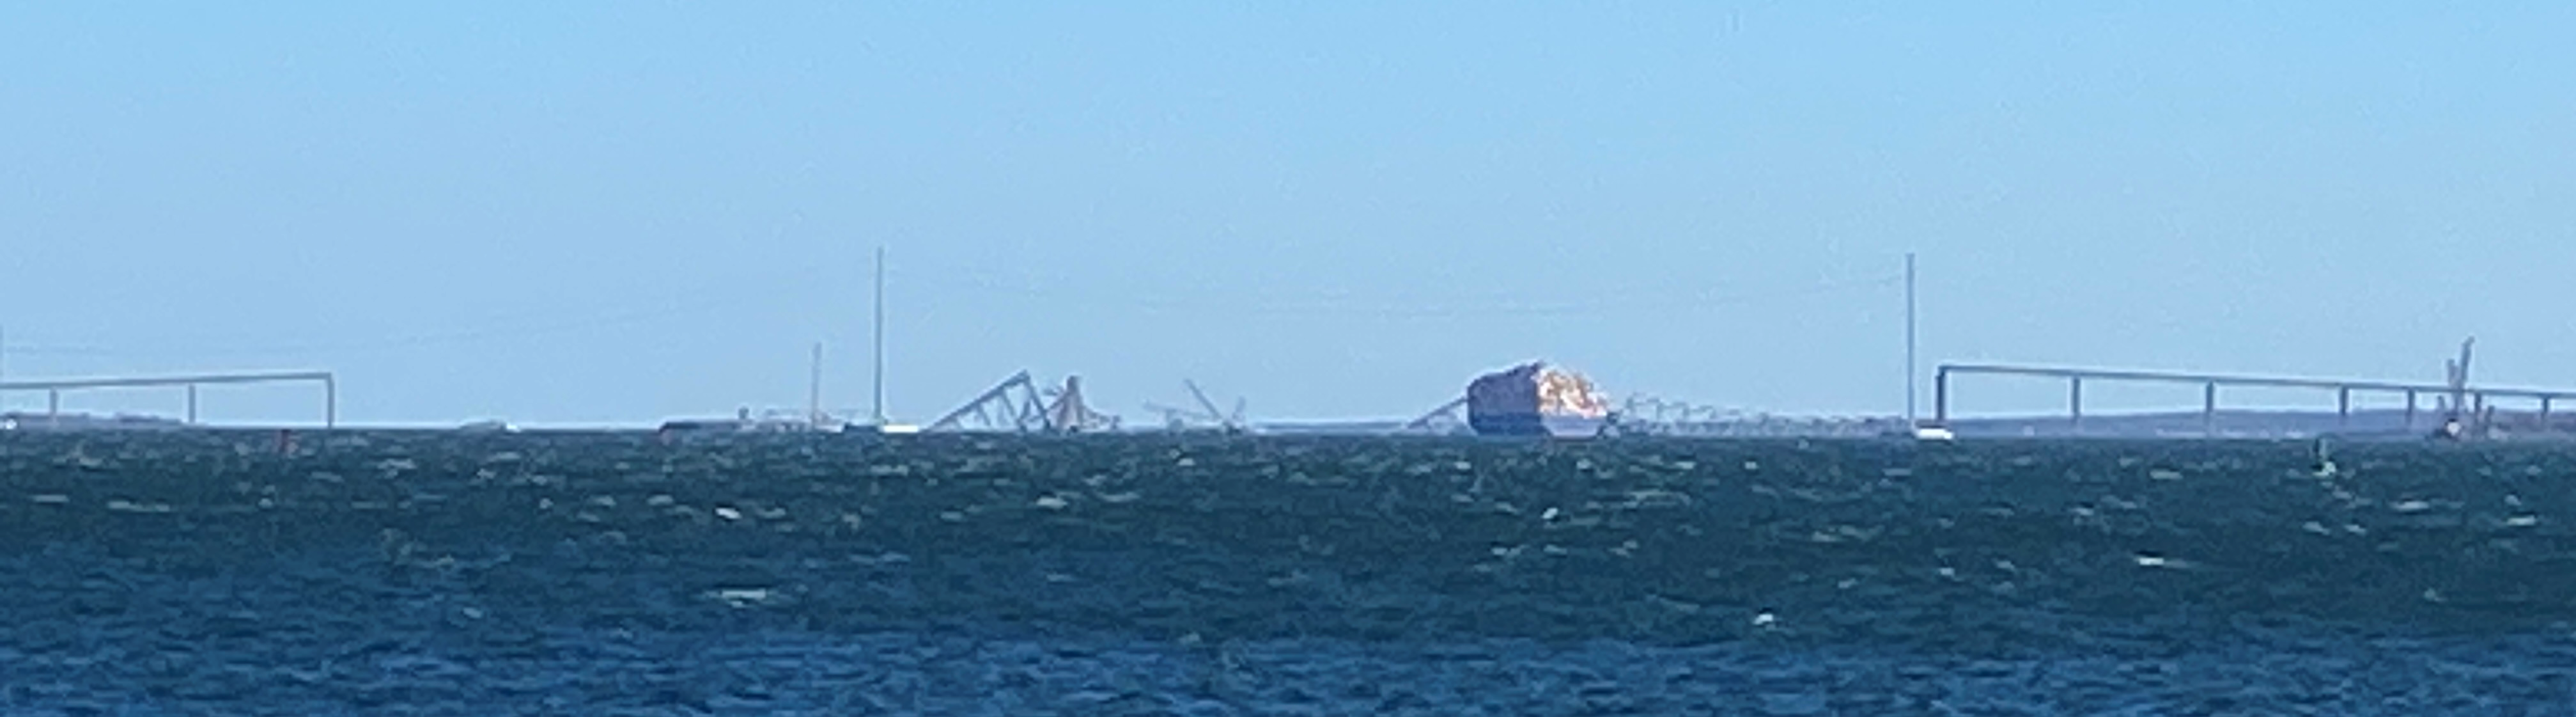
Remains of the Francis Scott Key Bridge with container ship Dali, taken from Fort McHenry on March 30, 2024.
Source: Rolf Schmitt, Deputy Director, BTS