Daily Mobility Statistics
BTS has discontinued the “Daily Mobility Statistics” product, which estimated the number of Americans staying at home during the onset of COVID-19 as well as the temporal and spatial trip patterns (national-, state-, and county-level) of the traveling public over the subsequent months and years of the pandemic. This product will no longer be updated, with the final delivery received for the week of March 31-April 6, 2024.
BTS made this decision primarily due to the conclusion of the federal COVID-19 pandemic declaration and the cessation of the need for this experimental daily product. While the data will no longer be updated, they will remain available to the public as an archived statistical product.
In turn, BTS is now undertaking a thorough re-evaluation of its plans for additional statistical programs based on probe and location-based services data, to include an ex-post-facto analysis of this specific program, with all findings to be published to the BTS website and ROSA-P.
As part of this evaluation, BTS welcomes public comment on probe-based datasets like the Daily Mobility Statistics product and encourages users of these data to contact BTS with your comments and questions on the program, especially users’ thoughts on the advantages and disadvantages of this probe-based product. Public feedback on this program will be incorporated into BTS’ statistical program research.
In which States and Counties were people staying at home? Which ones had the most activity?
Dive into the map below to see what percentage of the population was staying at home in each state or county over the course of the COVID-19 pandemic. You can also use the Select A Metric drop-down to see state or county-level measures on the average number of daily trips.
How much were people traveling as the pandemic evolved?
Use the line graph below to see how the the number of trips changed over time. Then, use the Select A Metric drop-down to view changes in other measures over the course of the COVID-19 pandemic.
When they leave the home, how far were people traveling?
Were people going farther on each trip, or were they sticking close to home? Use the date selector to learn how patterns changed.
Explore the Daily Mobility Statistics on Your Own
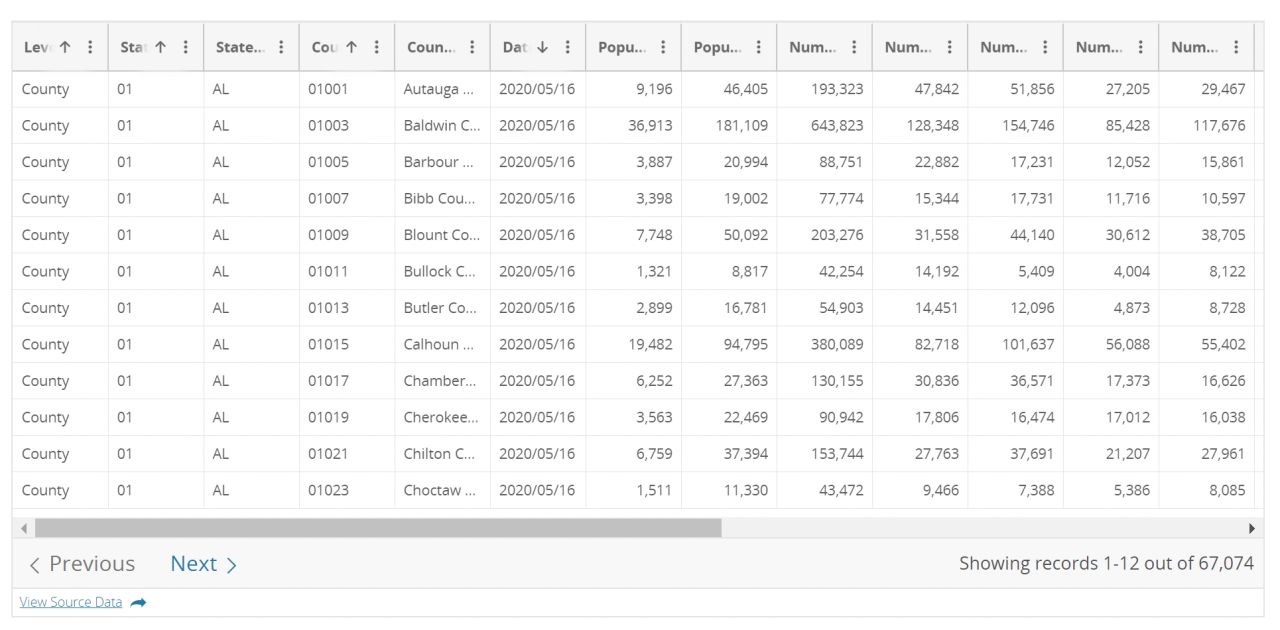
Click on the image below to see the metadata for the Daily Mobility Statistics in our Data Inventory. There, you can download the data or use the inventory platform to create your own visualizations and share them with others.
Source
The Daily Mobility Statistics were derived from a data panel constructed from several mobile data providers, a step taken to address the reduce the risks of geographic and temporal sample bias that would result from using a single data source. In turn, the merged data panel only included data from those mobile devices whose anonymized location data met a set of data quality standards, e.g., temporal frequency and spatial accuracy of anonymized location point observations, device-level temporal coverage and representativeness, spatial distribution of data at the sample and county levels. After this filtering, final mobility estimate statistics were computed using a multi-level weighting method that employed both device- and trip-level weights, thus expanding the sample represented by the devices in the data panel to the at-large populations of each state and county in the US.
Data analysis was conducted at the aggregate national, state, and county levels. To assure confidentiality and support data quality, no data were reported for a county if it had fewer than 50 devices in the sample on any given day.
Trips were defined as movements that included a stay of longer than 10 minutes at an anonymized location away from home. A movement with multiple stays of longer than 10 minutes--before returning home--was counted as multiple trips.
Experimental data
The Daily Mobility Statistics data on this page, which cover the COVID and Post-COVID periods, are experimental. Experimental data products are created using novel or exploratory data sources or methodologies that benefit data users in the absence of other statistically rigorous products, and they not meet all BTS data quality standards.
Methodology
The methodology used to develop the Daily Mobility Statistics can be found at this link.

