85% of Rural Residents Have Reasonable Access to Intercity Transportation; Lack of Reasonable Access Falls Disproportionately on Low-Income Households
Data spotlights represent data and statistics from a specific period of time, and do not reflect ongoing data collection. As individual spotlights are static stories, they are not subject to the Bureau of Transportation Statistics (BTS) web standards and may not be updated after their publication date. Please contact BTS to request updated information.
85% of Rural Residents Have Reasonable Access to Intercity Transportation; Lack of Reasonable Access Falls Disproportionately on Low-Income Households
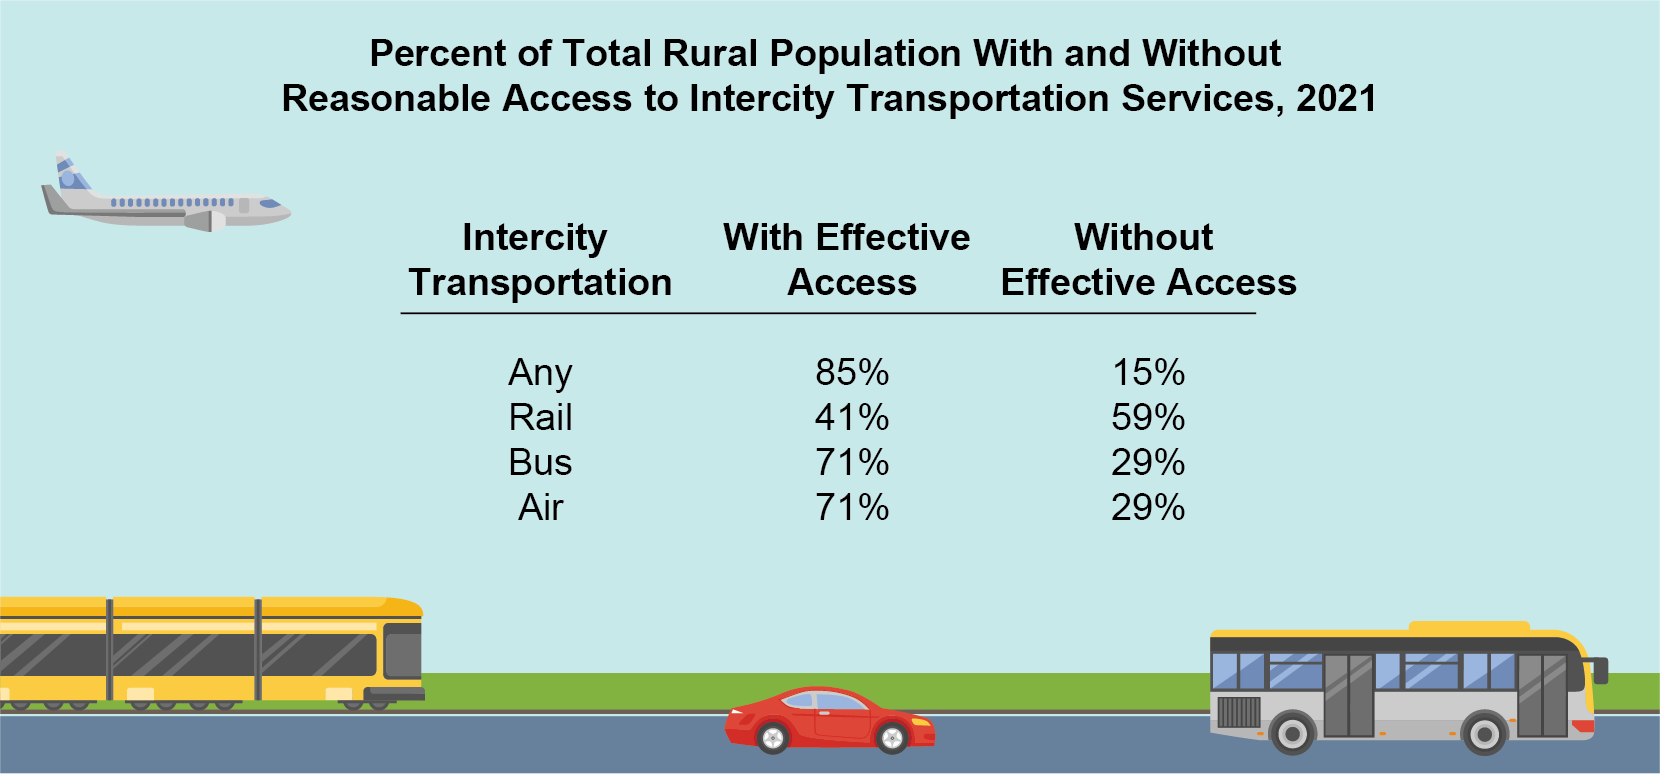
In 2021, 85% of the nation’s 88.8 million rural residents had reasonable access to intercity transportation. Reasonable access means that they lived within 75 miles of a large airport or within 25 miles of a smaller airport, intercity bus stop, or intercity rail station with scheduled service. The Bureau of Transportation Statistics’ (BTS) released an interactive map application today that displays the percent of rural population with reasonable access to intercity transportation services.

Excluding rural residents living on the fringe of an urban area increases the percentage of rural without reasonable intercity transportation access from 15% to 25%. In other words, the most remote areas, regions that are far away from major cities or heavily populated areas, have significantly lower access to intercity transportation. Populations in rural areas without reasonable access to intercity transportation disproportionately include low-income households.
In 25 states, the percentage of rural residents without reasonable access to intercity transportation exceeded 15% in 2021. In 12 states, that percentage exceeded 25%. In South Dakota, 62% of rural residents lacked reasonable access to scheduled intercity transportation in 2021, which is the greatest percentage of any state.

NOTE: Summarized from county level where county data available for all years and facilities providing scheduled service.
SOURCE: US Department of Transportation, Bureau of Transportation Statistics Access to Intercity Transportation database, available at https://data.bts.gov/stories/s/gr9y-9gjq
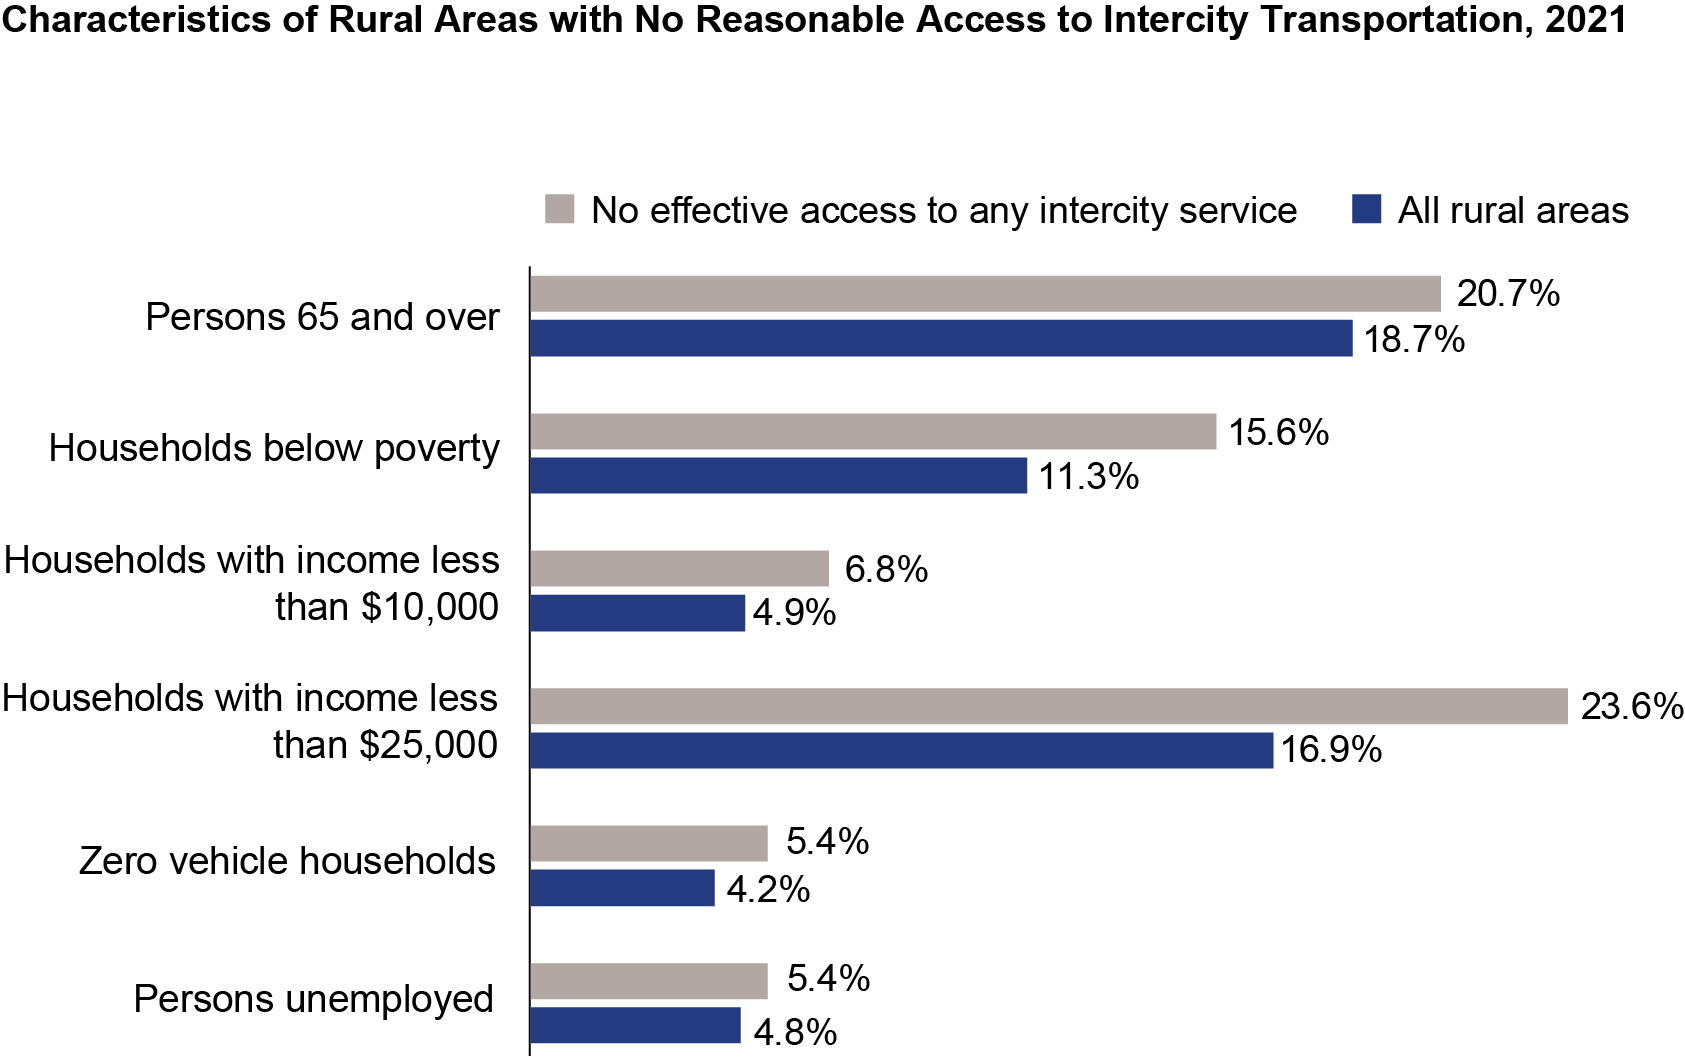
Populations in rural areas without reasonable access to intercity transportation disproportionately include low-income households. In 2021, households with an income of less than $25,000 accounted for 17% of total rural households but they accounted for a disproportionately larger share (24%) of the rural households lacking reasonable access to intercity transportation. The percent of the population aged 65 and over, the percent unemployed, and the percent of zero vehicle households also tends to be higher in rural areas without reasonable intercity transportation access, but the difference is less disproportional.

NOTE: Summarized from county where county data available and for facilities providing scheduled service.
SOURCE: US Department of Transportation, Bureau of Transportation Statistics Access to Intercity Transportation database, available at https://data.bts.gov/stories/s/gr9y-9gjq
BTS’ interactive map application shows, by county, the percent of the rural population with reasonable access to scheduled air (commercial), intercity bus, and/or intercity rail transportation for the years 2006, 2012, 2018, and 2021. The map also shows, by county, the change in the number of intercity transportation facilities from 2006-2021 and the locations of the facilities in each year. For 2018 and 2021, additional filters are available to select counties where rural areas possess select demographic and socio-economic characteristics, for example counties where 10% of the rural population are 65 and older. Data for 2006-2018 have been updated since the last release.
