
BTS Mines Multiple Data Sources for Clues to Post-Pandemic New Transportation Normal
Data spotlights represent data and statistics from a specific period of time, and do not reflect ongoing data collection. As individual spotlights are static stories, they are not subject to the Bureau of Transportation Statistics (BTS) web standards and may not be updated after their publication date. Please contact BTS to request updated information.
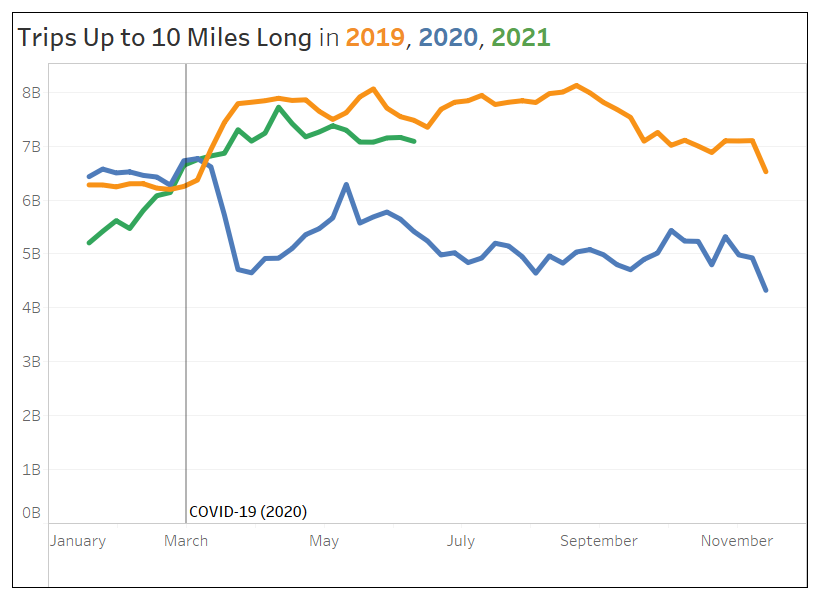
When combined with pulse surveys and other data, measuring daily travel patterns during the COVID-19 pandemic can help identify trends that might become a “new normal” in post-pandemic transportation in the U.S. For example, travel data, as in the chart below, shows a gradual increase in short trips from January to April in 2021 (green line) that brings the Nation closer to 2019 trip frequencies.
But, the data don’t show where people are going or how. Adding two more data sources fills in some of the gaps by showing a gradual in-person return to the store --including more trips by transit-- and less substitution with online shopping.
Online shopping declines as a replacement for in-person shopping.
From the National Household Travel Survey (NHTS), we know that 21% of trips 10 miles or shorter involve shopping. Transportation data from Census Household Pulse Surveys, shown in the chart below, indicate that many Americans replaced online shopping with in-person shopping during different periods of the pandemic.
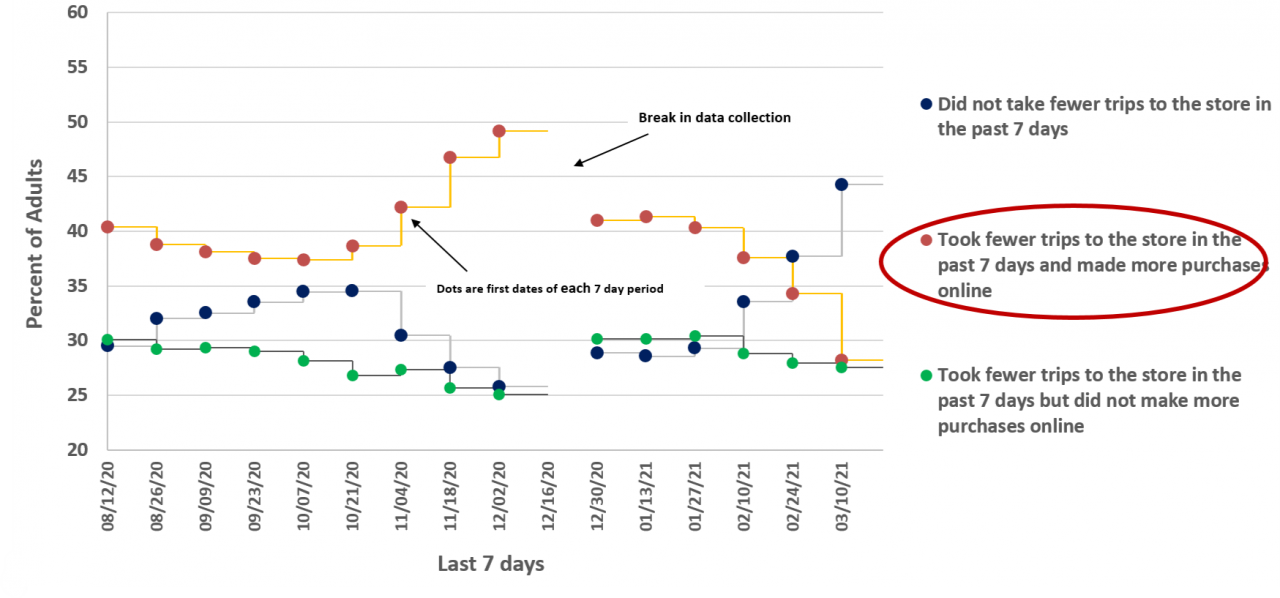
Should the late-January to March 2021 uptick in store trips (the blue dots above) be attributed to a typical winter pattern or to higher vaccination rates, a gradual re-opening of businesses, and reductions in capacity restrictions? The Trips Up to 10 Miles Long chart suggests which variables might be at work by demonstrating that in pre-pandemic days (the orange line), short trips didn’t increase until mid-March 2019 as winter gave way to spring. Therefore, the upward trend in trips to the store or other local destinations that began in late January 2021 (the green line) could be attributable to increased vaccination and the lessening of pandemic restrictions. More research is needed.
Transit ridership increase coincides with in-person shopping trip increase.
![]()
Census pulse data in the chart above show fewer persons reporting reductions in their transit trips (compared to before the pandemic) starting in late-January 2021. The NHTS indicates that 14% of transit trips are shopping trips, and the pulse survey data indicate increased in-person shopping beginning in the same period as the partial return to transit. From these three sources, would it be reasonable to attribute some of the transit ridership increase in 2021 to people shopping more in person? Again, more research is needed, but again, multiple data sources paint a more complete picture.
Transportation data is a finger on the pulse of post-pandemic U.S. activity.
Where are we now in terms of pandemic travel? Americans are resuming activity, traveling to stores in-person, and gradually returning to transit. It takes multiple data sources to draw these tentative conclusions. As the Nation emerges from the COVID-19 pandemic, BTS will continue analyzing as much data as possible to help identify a post-pandemic new transportation normal.