
COVID-Affected Micromobility Changes Differ by City
Data spotlights represent data and statistics from a specific period of time, and do not reflect ongoing data collection. As individual spotlights are static stories, they are not subject to the Bureau of Transportation Statistics (BTS) web standards and may not be updated after their publication date. Please contact BTS to request updated information.
For bikeshare and e-scooter systems, responses to the COVID-19 pandemic have been more localized than national. BTS’s recently updated Bikeshare and E-Scooter Systems in the U.S. dashboard illustrates three facts that challenge a national pattern: a decrease in the number of cities served by bikeshare and e-scooter platforms, a countervailing increase in the number of docking stations available in the U.S., and ridership trends that vary distinctly from city to city.
Bikeshare and E-Scooter Systems: 2019 vs 2021
| 2019 | 2021 | |
|---|---|---|
| Docked Bikeshare | 103 | 66 |
| Dockless Bikeshare | 71 | 60 |
| E-Scooter | 239 | 214 |
COVID-19 takes a bite out of micromobility in some cities…
As the table above shows, the number of docked bikeshare systems in the U.S. declined from a high of 103 in 2019 to 66 in 2021 as 37 docked bikeshare systems closed permanently following a temporary suspension of operations at the onset of COVID-19. In June 2021, 60 dockless bikeshare systems and 214 e-scooter systems were open (not counting systems limited to college or employer campuses); that’s down from a 2019 high of 71 and 239.
…As riders in other cities bite back.
The decline in the number of docked bikeshare systems serving U.S. cities might lead you to think there’s been a corresponding decrease in the number of bike docking stations. But, as the chart below shows, we’ve seen a surprising 9% increase in the number of stations (7,386) since 2019 (6,755).
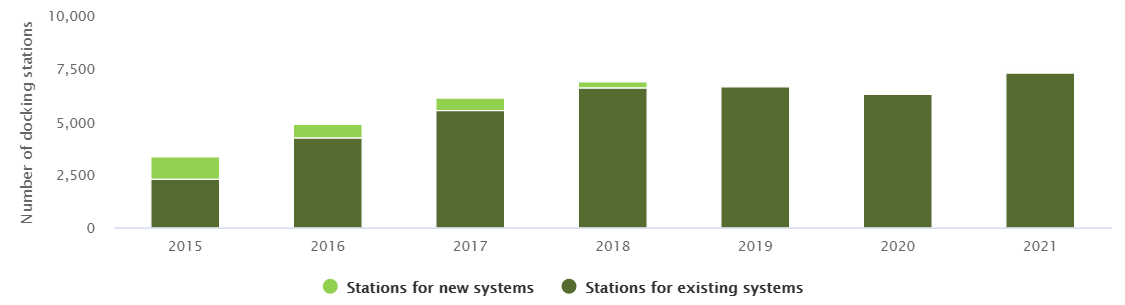
Source: BTS, https://data.bts.gov/stories/s/Bikeshare-and-e-scooters-in-the-U-S-/fwcs-jprj/
What do these seemingly diverging trends mean for bikeshare? In some of the cities that have retained their systems, many of those systems have added stations.
Ridership changes vary significantly from city to city.
Between 2019 and 2021, some cities saw increases in micromobility ridership in each month (Chattanooga, TN) while others saw decreases (Minneapolis/St. Paul, MN) and still others (Columbus, OH) have seen increases in some months and decreases in others.
NOTE: In the charts below, Bike Chattanooga only offers Docked Trips, and Nice Ride Minneapolis/St Paul closes during winter months.
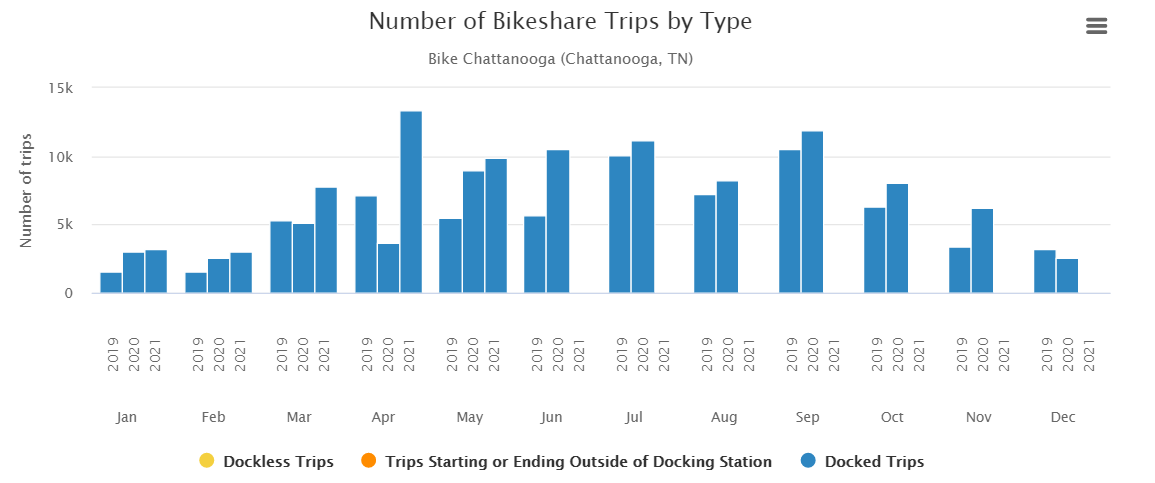
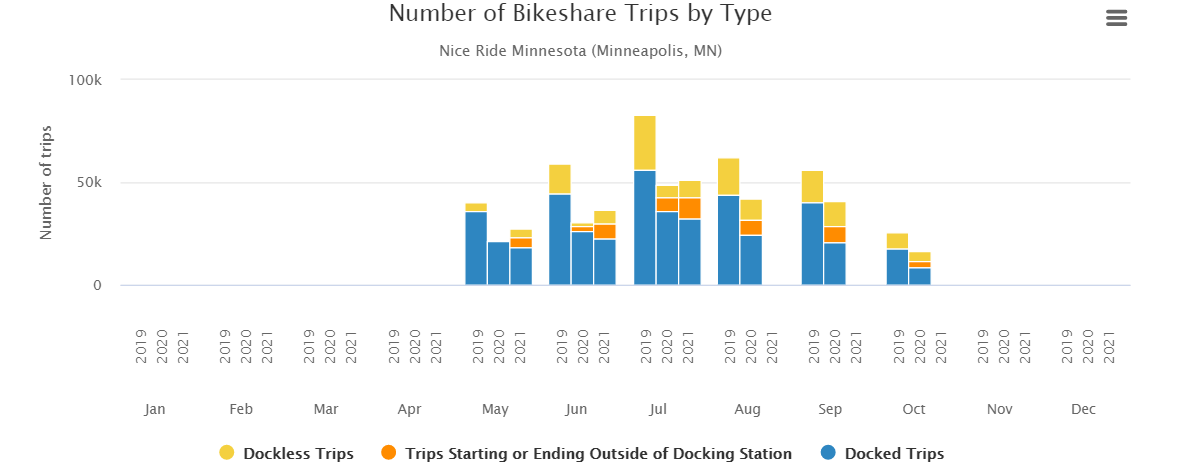
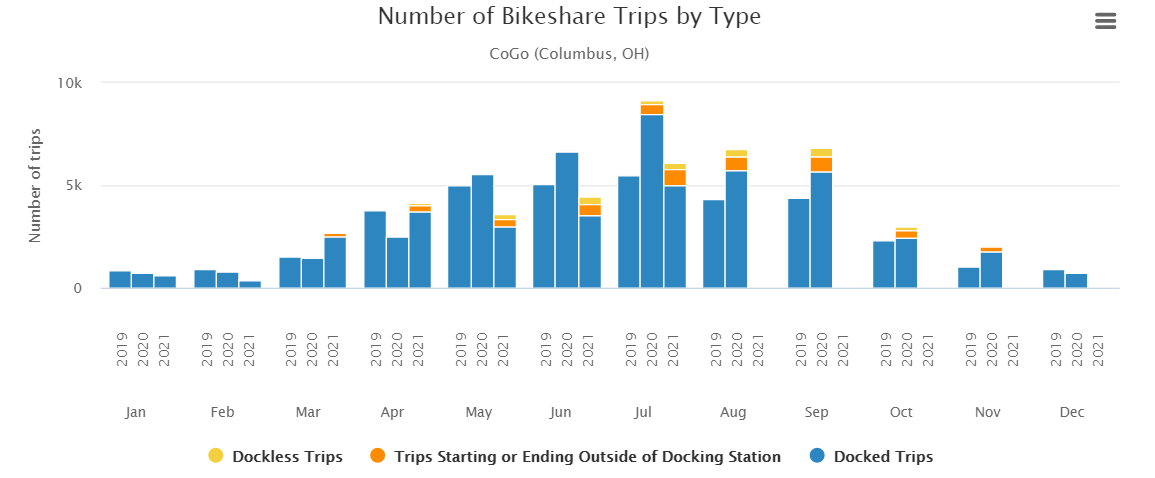
Source: BTS, https://data.bts.gov/stories/s/Bikeshare-and-e-scooters-in-the-U-S-/fwcs-jprj/
Interested in micromobility data?
If you’re ready to explore the latest data on bikeshare and e-scooter systems, there’s no better place to start than the BTS Bikeshare and E-scooter Systems in the U.S. dashboard. For even more data, start at our Bikeshare and E-scooter Data Gateway page.