Docked Bikeshare Ridership Increase in 2023 on Most but Not All Systems
Data spotlights represent data and statistics from a specific period of time, and do not reflect ongoing data collection. As individual spotlights are static stories, they are not subject to the Bureau of Transportation Statistics (BTS) web standards and may not be updated after their publication date. Please contact BTS to request updated information.
Note: Data for quarter 4 of 2023 revised
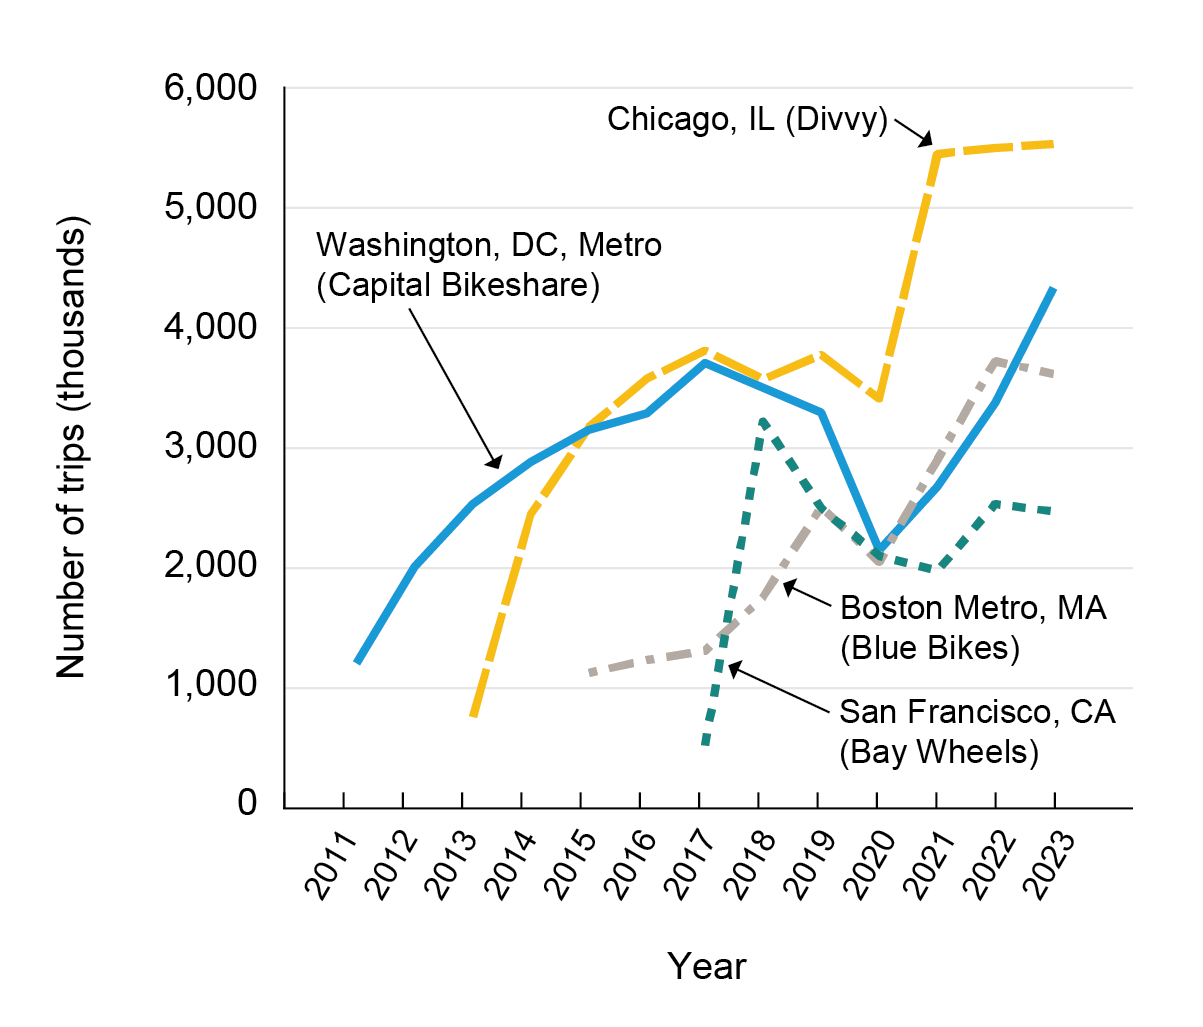
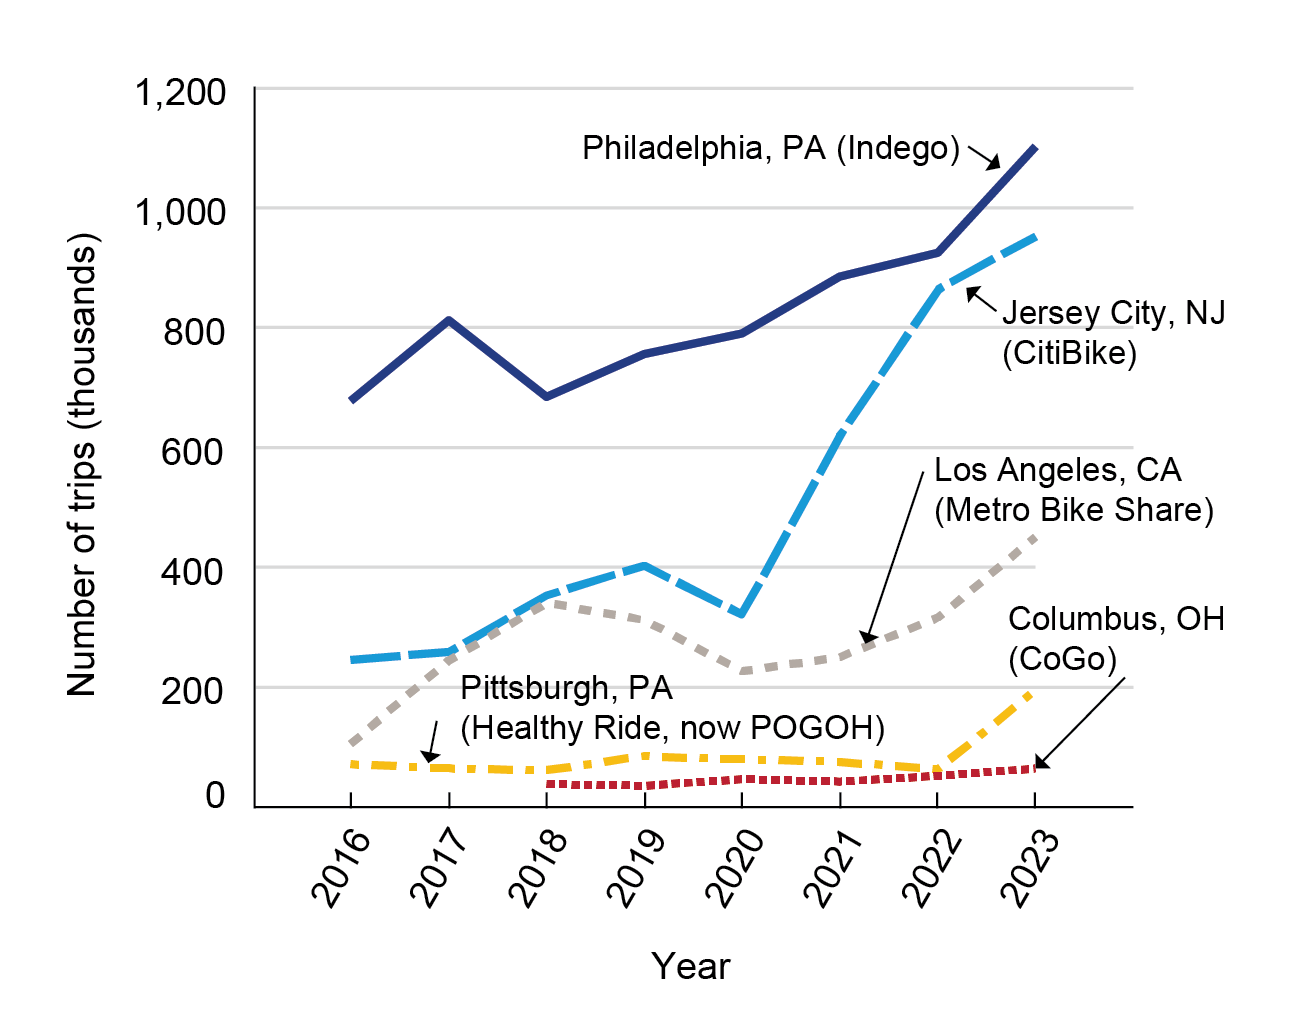
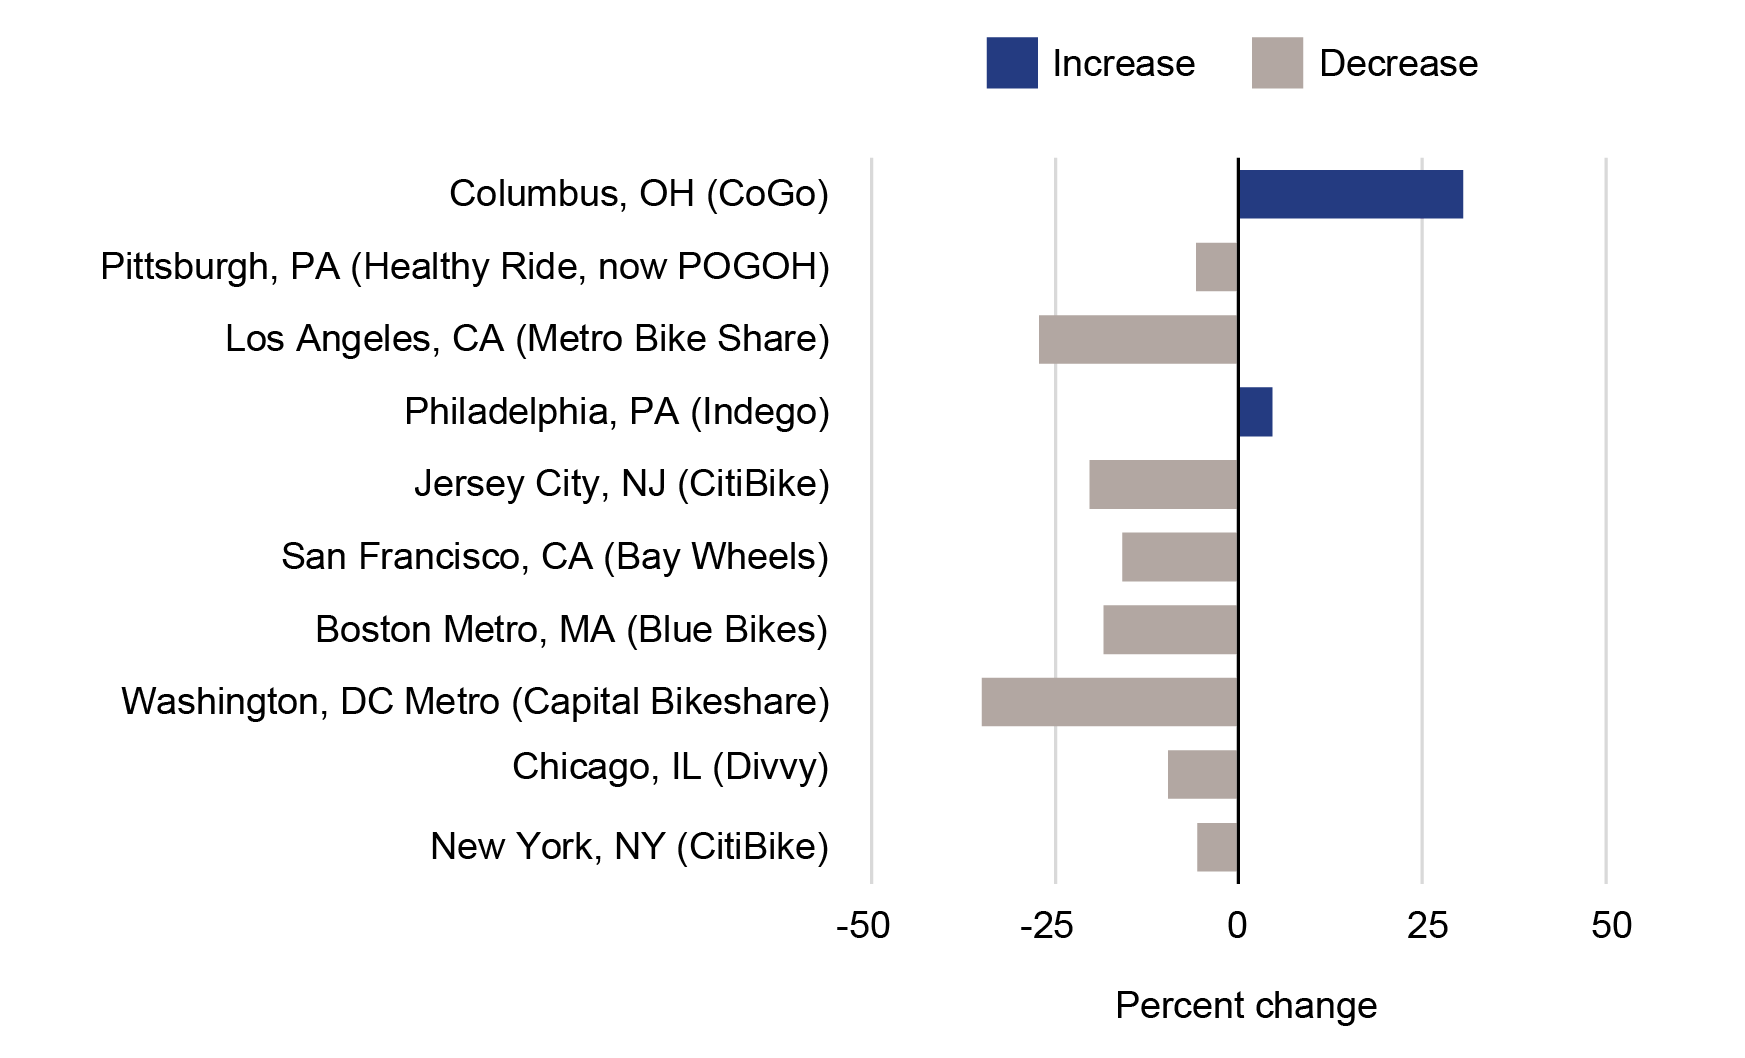
Most but not all docked bikeshare systems experienced an increase in ridership in 2023 (figure 1). In 2023, ridership declined 3% on BlueBikes (serving the Boston, MA metro area) and 2% on Bay Wheels (serving the San Francisco, CA area). With the exception of Bay Wheels, growth on BlueBikes in years prior to 2023 more than offset the decline experienced during 2020, when COVID-19 significantly reduced ridership on nearly all systems (figures 2 and 3). Ridership on Bay Wheels, on the other hand, was 1% percentage point below the 2019 level in 2023.
Figure 1: Docked Bikeshare Trips By Size of System
|
Large Systems 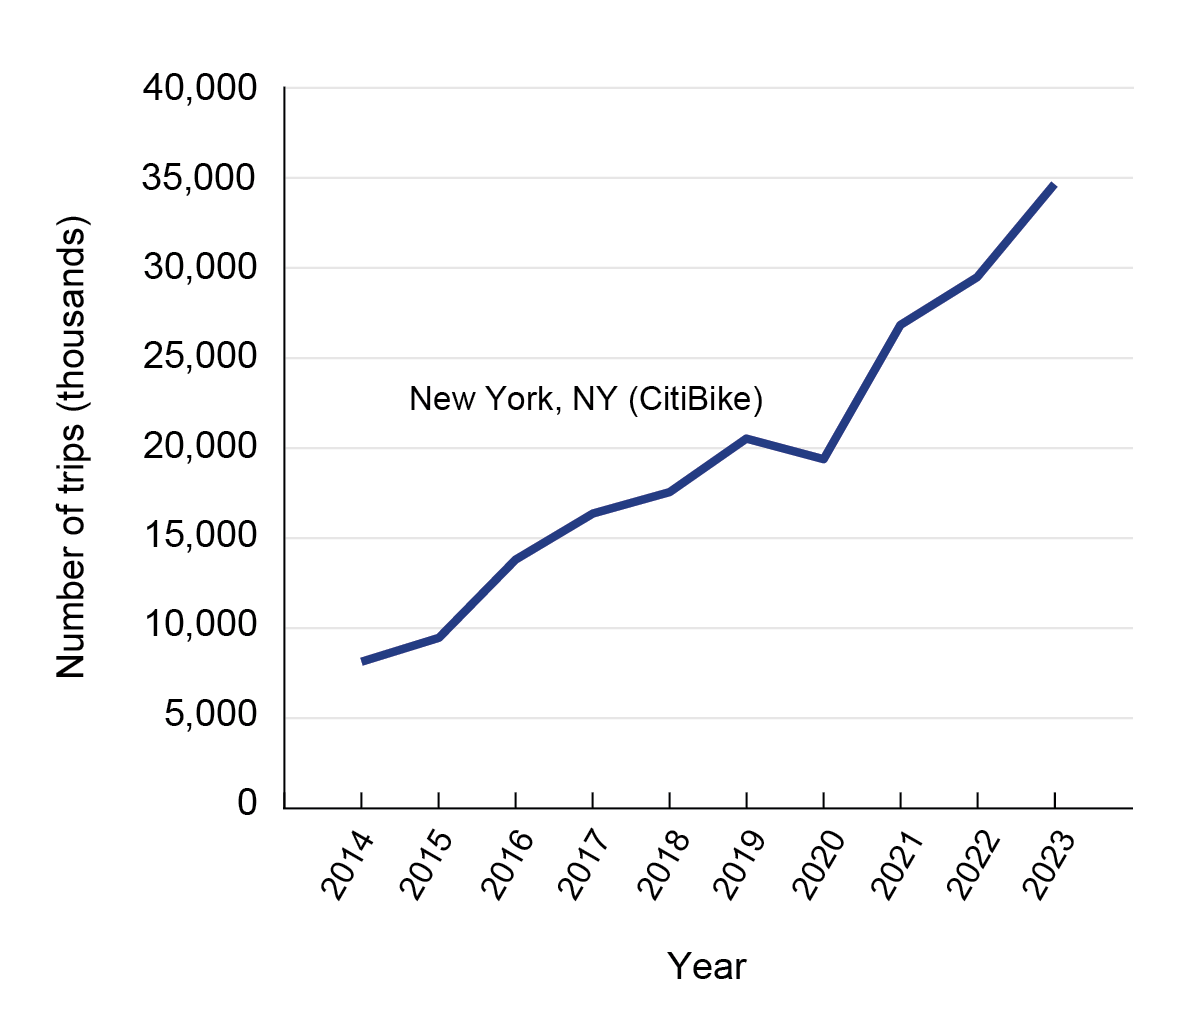 |
Medium-Sized Systems |
|
Small Systems
|
Note: Size of system classifed by number of trips. Data presented since launch of system where available (Washington, DC (Capital Bikeshare); Chicago, IL (Divvy); Philadelphia, PA (Indego); Pittsburgh, PA (POGOH); Jersey City, NJ (CitiBike); and Los Angeles, CA (Metro Bike Share)). First year of data is a partial year for the following systems: Washington, DC (Capital Bikeshare) begins in September 2010; Chicago, IL (Divvy) begins in June 2013; Philadelphia, PA (Indego) begins in April 2015; Jersey City, NJ (CitiBike) begins in September 2015; San Francisco, CA (Bay Wheels) begins in June 2017; and Columbus, OH (Cogo) begins in February 2018. Name of system corresponds with name in 2023, with many systems having changed names over the years.
Source: U.S. Department of Transportation, Bureau of Transportation Statistics, Docked Bikeshare Trips, available at https://data.bts.gov/Research-and-Statistics/Docked-Bikeshare-Ridership/6cfa-ipzd as of June 2024
Figure 2: Effects of COVID-19 on Docked Bikeshare Ridership and Recovery Through 2023
Source: U.S. Department of Transportation, Bureau of Transportation Statistics, Docked Bikeshare Trips, available at https://data.bts.gov/Research-and-Statistics/Docked-Bikeshare-Ridership/6cfa-ipzd as of June 2024
Figure 3. Contribution of Year-Over-Year Change in Docked Bikeshare Trips to Total Percent Change in 2023 from 2020 Level
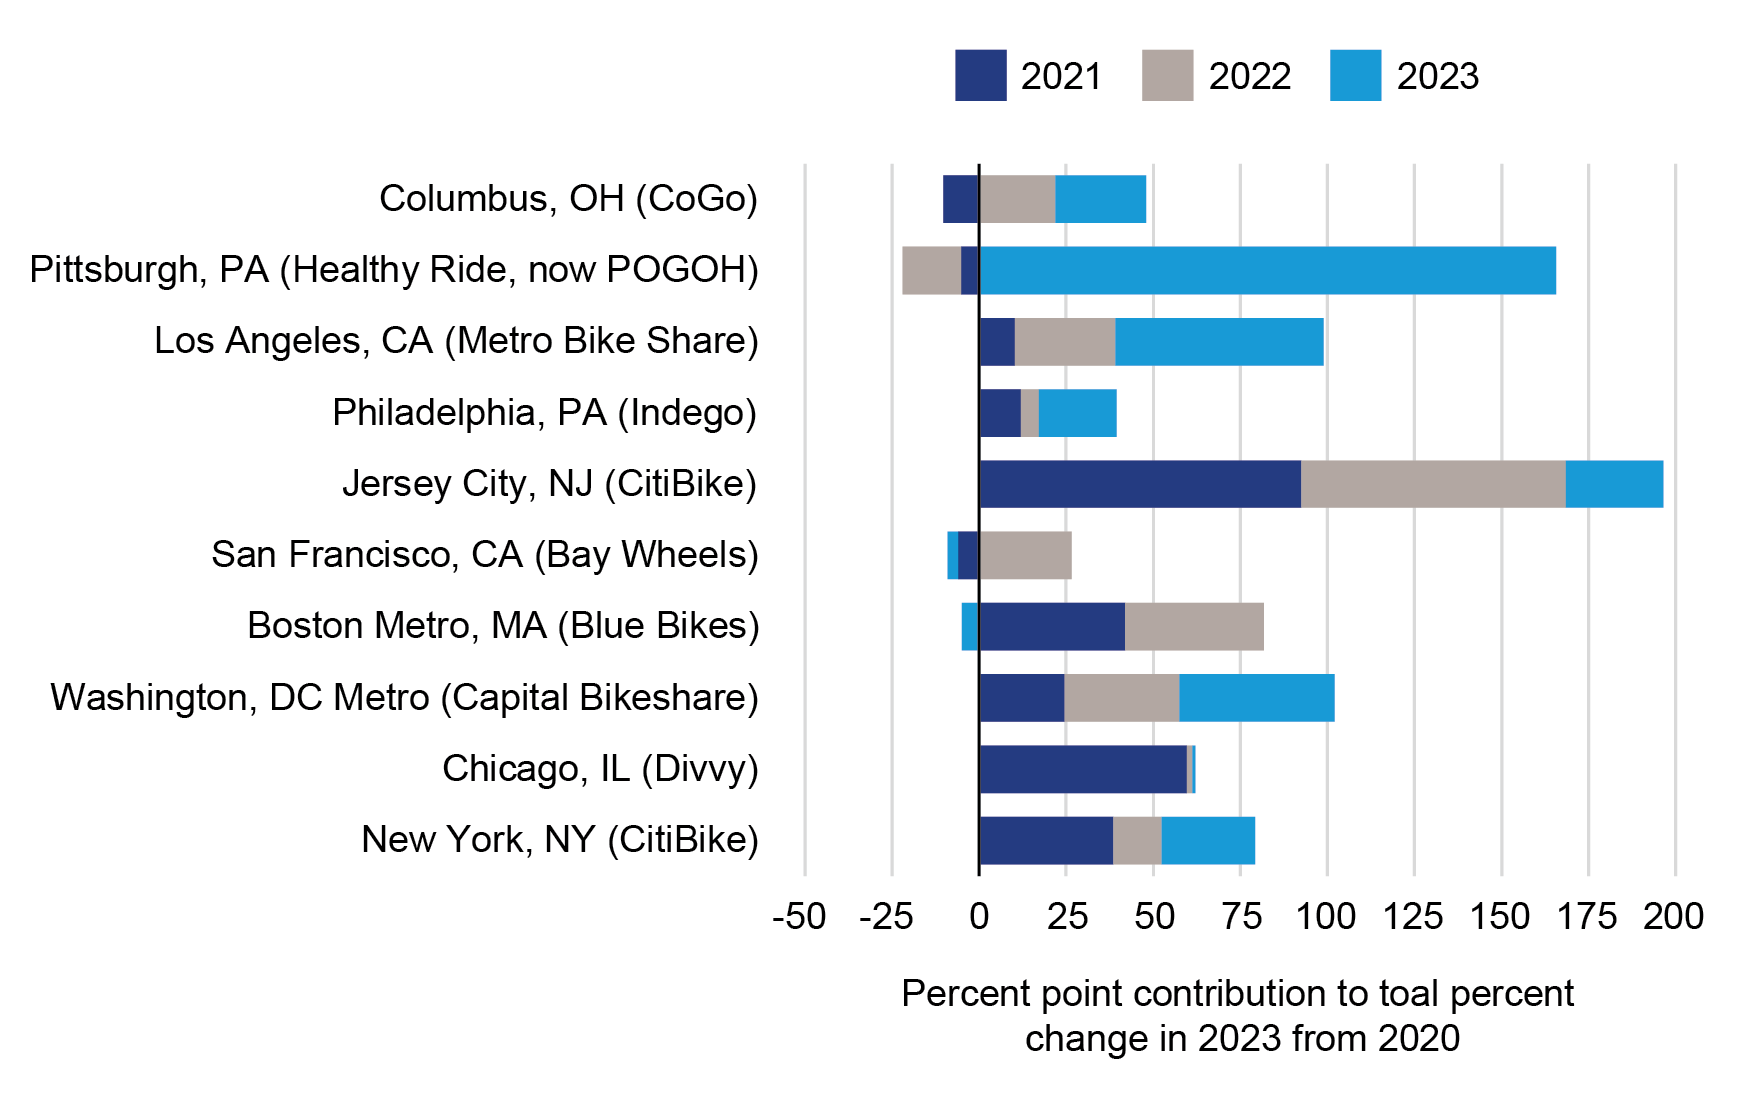
Source: U.S. Department of Transportation, Bureau of Transportation Statistics, Docked Bikeshare Trips, available at https://data.bts.gov/Research-and-Statistics/Docked-Bikeshare-Ridership/6cfa-ipzd as of June 2024
Of the systems that experienced an increase in ridership in 2023, POGOH (serving Pittsburgh, PA) grew the most at 212%. This growth came after expansion of the system in 2023.1 In 2023, MetroBike LA (serving Los Angeles, CA) grew the second-most at 43% — the largest annual growth since the launch of the system in July 2016 (figure 4).2 Growth on Capital Bikeshare (serving the Washington, DC metro area) was the second largest absolute annual growth (28%) since the launch of the system. The growth in ridership on Capital Bikeshare corresponds with more e-bikes being added to the system in the Spring of 2023 and a greater presence of workers in DC area buildings. 3,4
Figure 4: Top Three Largest Year-Over-Year Changes in Docked Bikeshare Trips
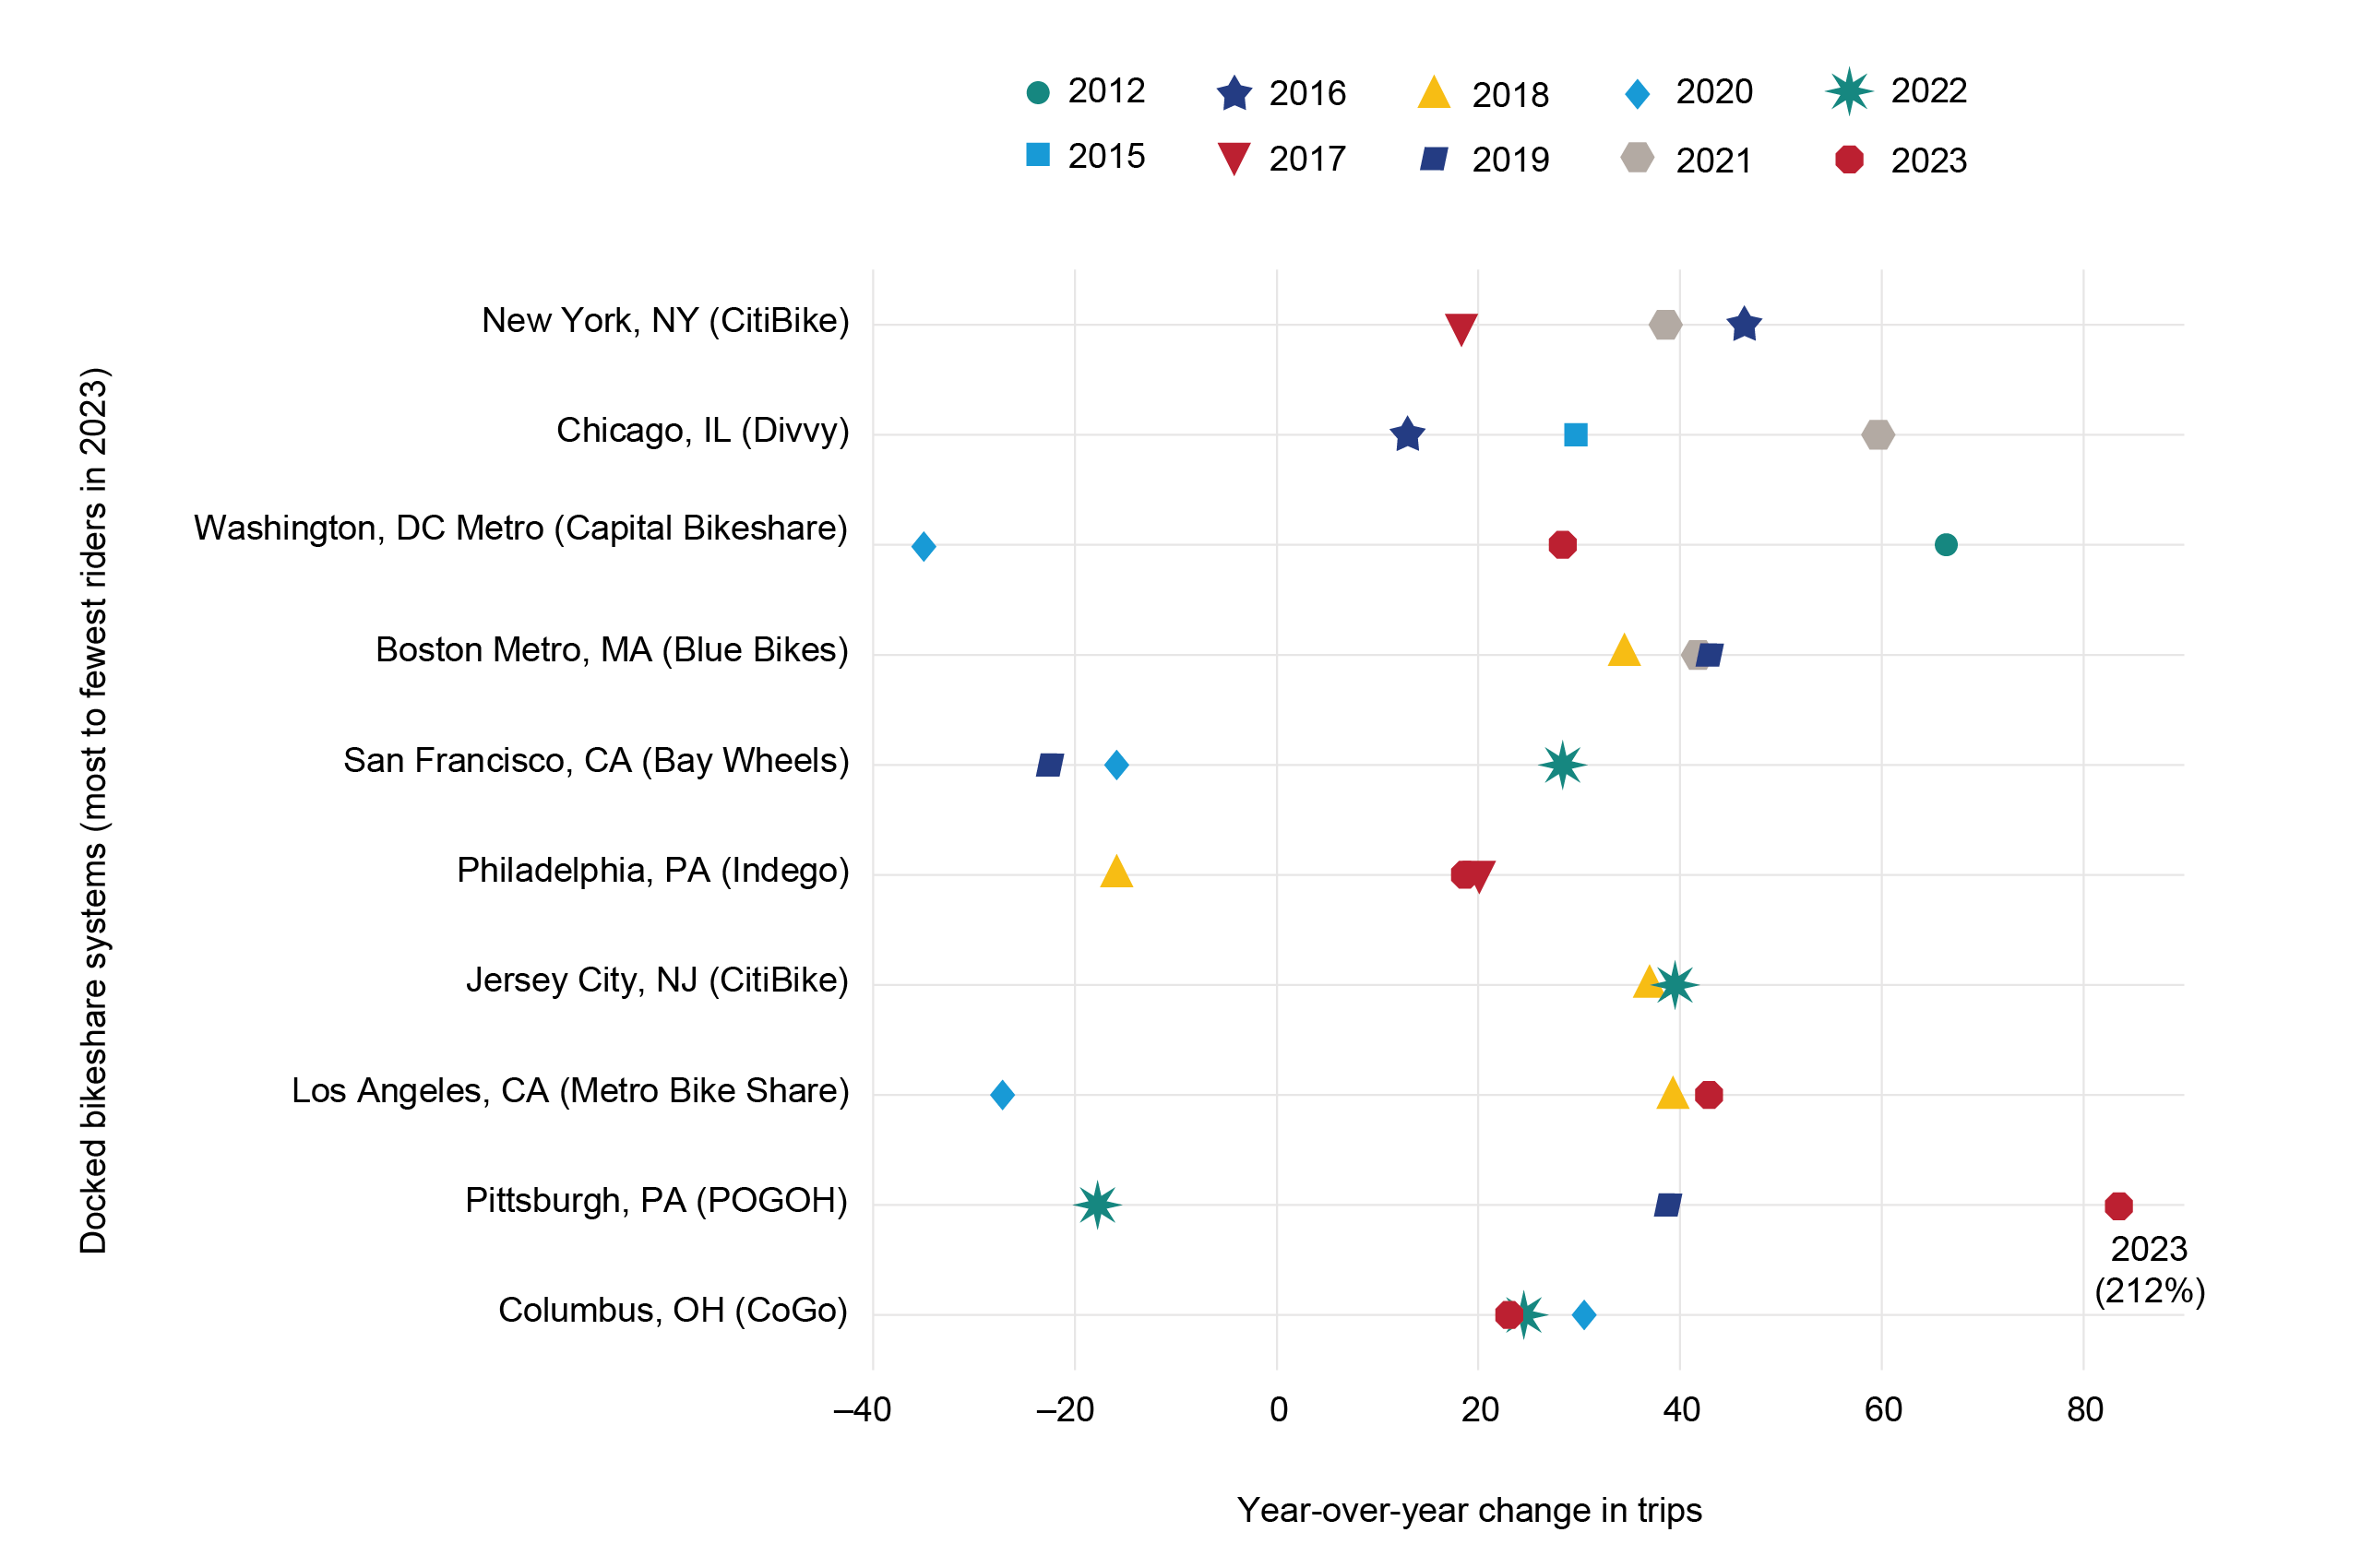
Note: Top three calculated using absolute value and starting with first full year of operation.
Source: U.S. Department of Transportation, Bureau of Transportation Statistics, Docked Bikeshare Trips, available at https://data.bts.gov/Research-and-Statistics/Docked-Bikeshare-Ridership/6cfa-ipzd as of June 2024
For more docked bikeshare statistics and other micromobility data and visualizations, see the Bureau of Transportation Statistics e-scooter and bikeshare (docked and dockless) webpage. In January 2024, the Bureau of Transportation Statistics expanded its docked bikeshare data to include data for years prior to 2019, with records beginning at the launch of most docked bikeshare systems.
Note the numbers in this article may differ from numbers cited elsewhere due to the exclusion of trips shorter than 1 minute or greater than 2 hours and on systems that require bikes to be docked at a station, trips with no start and/or end station identifier. Additionally, the 2023 statistics here include trips shorter than 2 hours that started in 2022 but ended in 2023 and exclude trips shorter than 2 hours that started in 2023 but ended in 2024.
1POGOH was formerly Healthy Ride. Healthy Ride underwent an equipment replacement and rebrand in 2022.
2Based on years where the system operated the entire year.
3Lazo, Luz. “Meet Capital Bikeshare’s New E-Bike. 850 Will Hit the Streets This Spring,” Washington Post, March 20, 2023, available at https://www.washingtonpost.com/transportation/2023/03/20/capital-bikeshare-ebike-expansion/ as of January 2024.
4Clabaugh, Jeff. “Post-Labor Day back-to-office spike in DC, but federal workers are still slow to return,” WTOP, available at https://wtop.com/business-finance/2023/10/post-labor-day-back-to-office-spike-in-dc-but-federal-workers-are-still-slow-to-return/ as of January 2024

