Holiday Surge in Travel Exceeds Last Year for Trips to Places between 50 and 500 Miles Away, but Is Still Less Than Last Year for Local Travel and Trips Over 500 miles
Data spotlights represent data and statistics from a specific period of time, and do not reflect ongoing data collection. As individual spotlights are static stories, they are not subject to the Bureau of Transportation Statistics (BTS) web standards and may not be updated after their publication date. Please contact BTS to request updated information.
This holiday season, a typical day saw more people staying home.
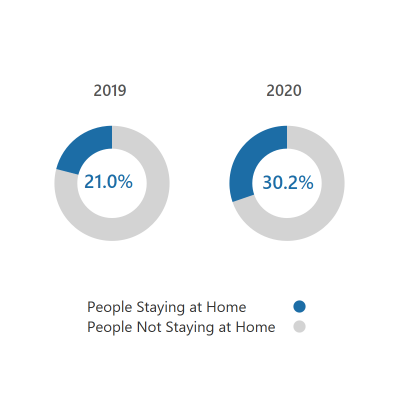
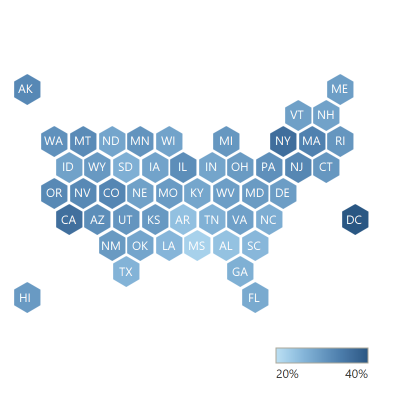
As the charts below show, on average, a greater percentage of Americans stayed home each day this holiday season (12/18/2020 - 1/3/2021) than during the previous year. Similar to Thanksgiving travel, Washington, DC, and New York State led the nation in the percentage of people staying home. California joined them as the third area with the greatest percentage of people staying home each day on average during the holiday period.
| Daily Average % of People Staying Home | Daily Average % Staying Home by State |
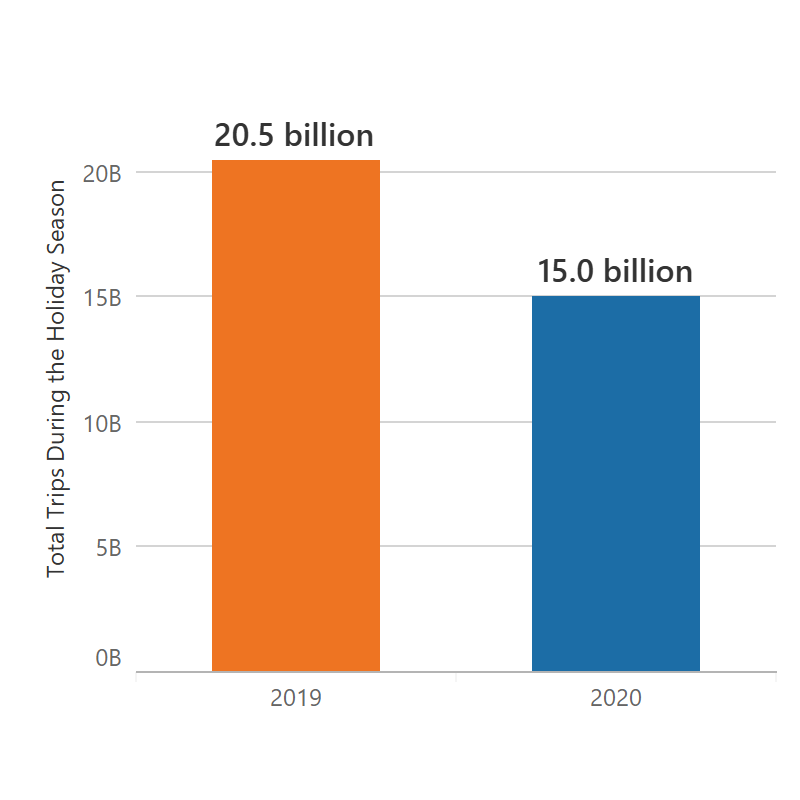
Total number of trips by all forms of transportation during the holiday season is estimated at 15 billion.
The holiday travel period saw an overall decline in the total number of trips taken by Americans, down 5.5 billion from the corresponding period a year earlier. This comes despite an increase in the number of people screened by the Transportation Security Administration (TSA) during the period. It also comes despite a year-over-year holiday increase in the number of trips made between 50 and 500 miles.
From December 18, 2020, through January 3, 2021, Americans made 15 billion trips. In the corresponding period the year before, they made 20.5 billion total trips.
Estimated Total Trips Made by All Forms of Transportation
TSA screenings got a holiday boost, but still lagged behind the previous year.
The 17.8 million people screened by TSA at U.S. airports this holiday season was down 56% from the 40.3 million screened during the previous year’s holiday season.
People Screened by TSA at U.S. Airports December 18 – January 3
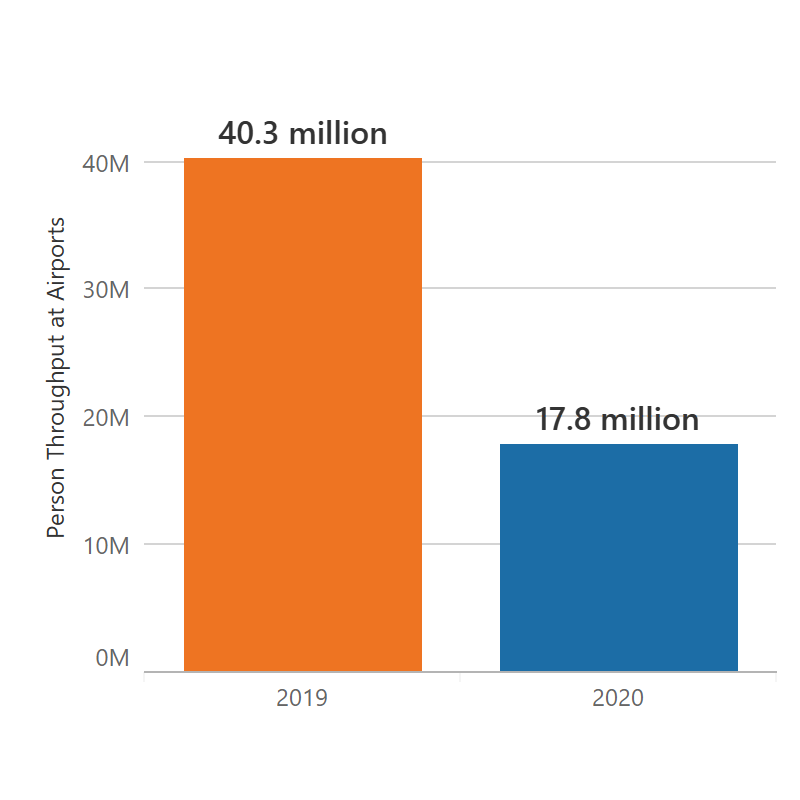
(2019-2020 in orange, 2020-2021 in blue)
Despite the year-over-year decrease, each of the last two weeks of the season (marked by points in the chart below) saw more people screened since the week of March 15, 2020.
People Screened by TSA at U.S. Airports by Week
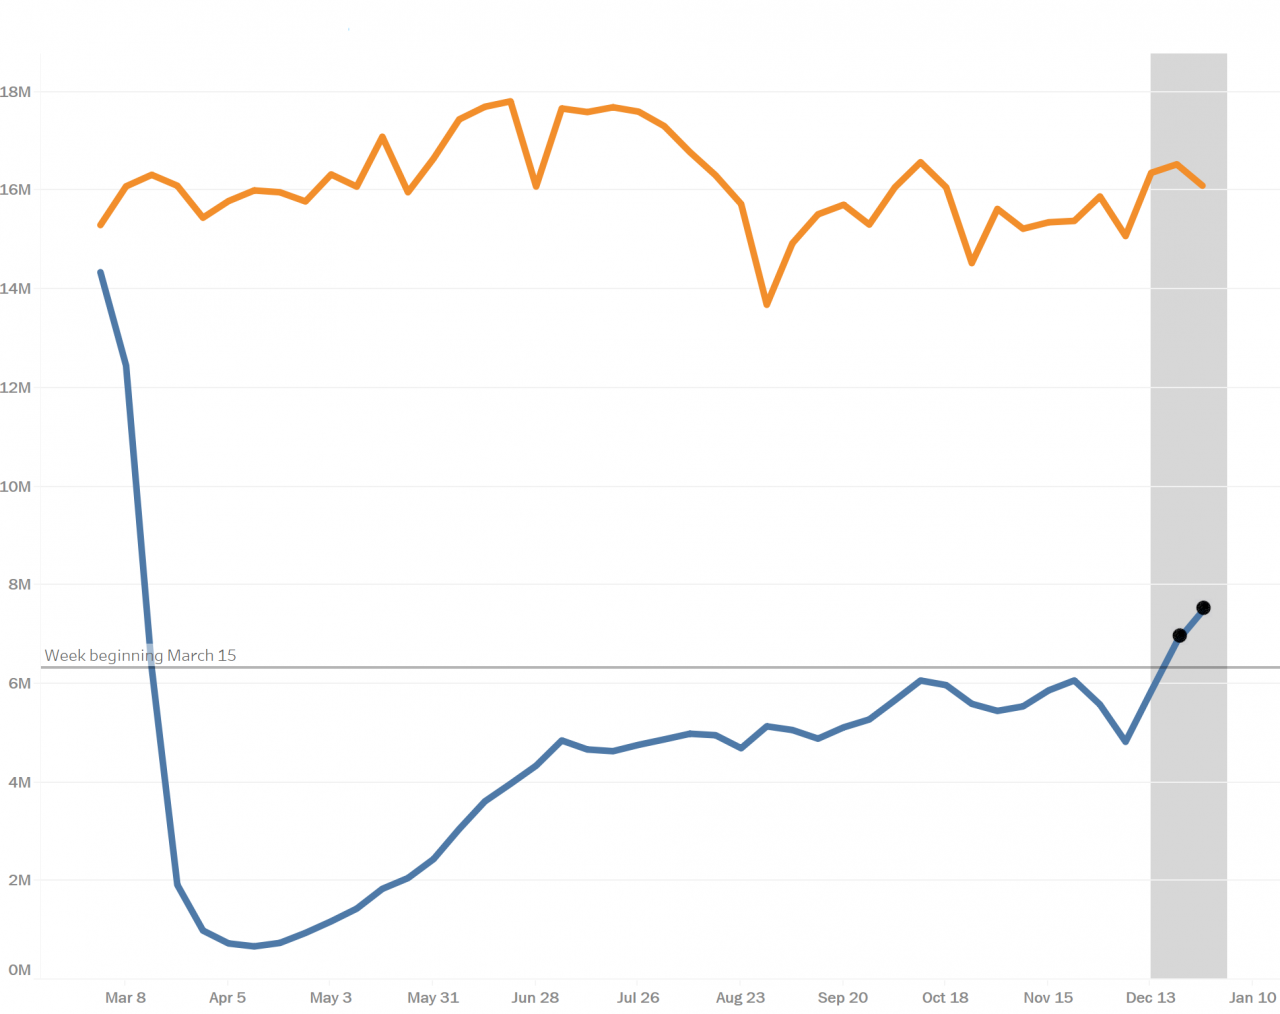
(2019 in orange, 2020 in blue)
And, December 27 and January 3 each saw more people screened on a given day than any day since March 16, with December 23 just slightly below March 16.
People Screened by TSA at U.S. Airports by Day
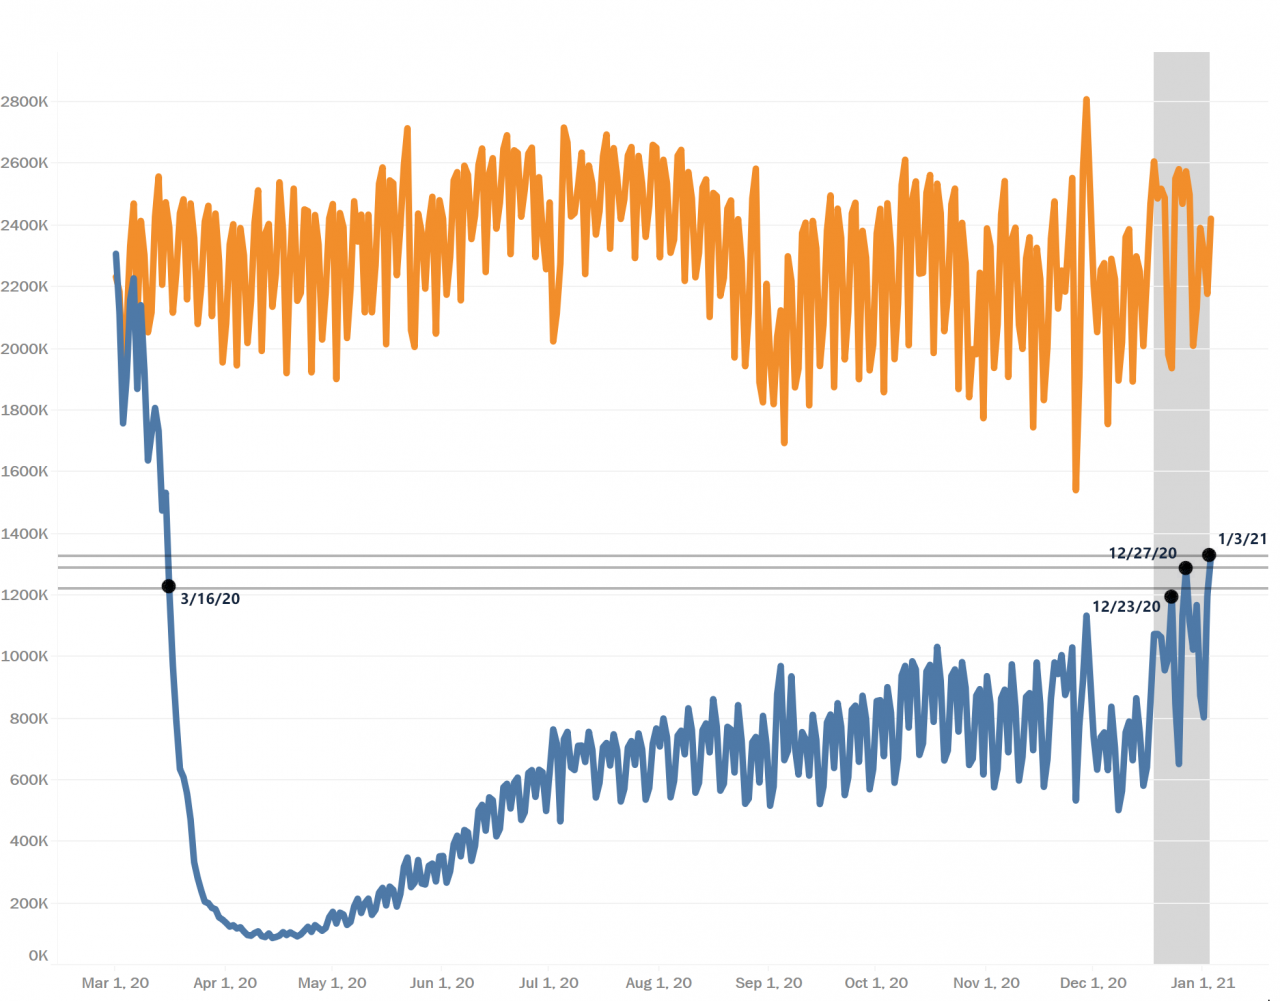
(2019 in orange, 2020 in blue)
Although many more shorter trips were made than longer trips, only 50-500-mile trips outpaced the previous year.
The 543.1 million trips taken between 50 and 500 miles represent a 24% increase over the previous year’s 439.8 million, as indicated by the chart on the right below.
| Shorter-Distance Trips | Longer-Distance Trips |
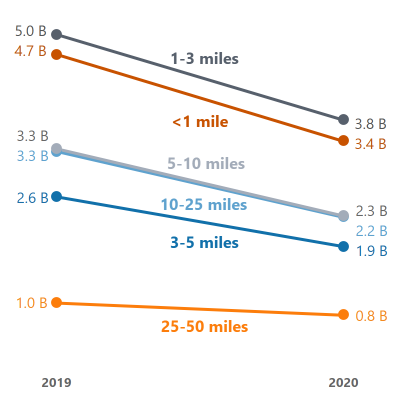
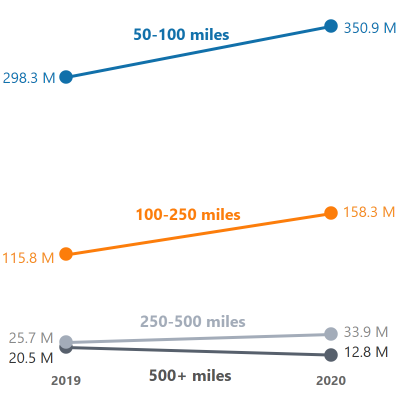
Sources:
People Staying Home, Traveling, Trips by Distance: The Maryland Transportation Institute (MTI) and the Center for Advanced Transportation Technology Laboratory (CATT Lab) at the University of Maryland, available for further viewing on our Daily Travel page or at https://data.covid.umd.edu/, and for download at https://data.bts.gov
People Screened: Transportation Security Administration (TSA), similar to https://www.tsa.gov/coronavirus/passenger-throughput)
