I-40 Bridge Failure Causes Multimodal Challenges
Data spotlights represent data and statistics from a specific period of time, and do not reflect ongoing data collection. As individual spotlights are static stories, they are not subject to the Bureau of Transportation Statistics (BTS) web standards and may not be updated after their publication date. Please contact BTS to request updated information.
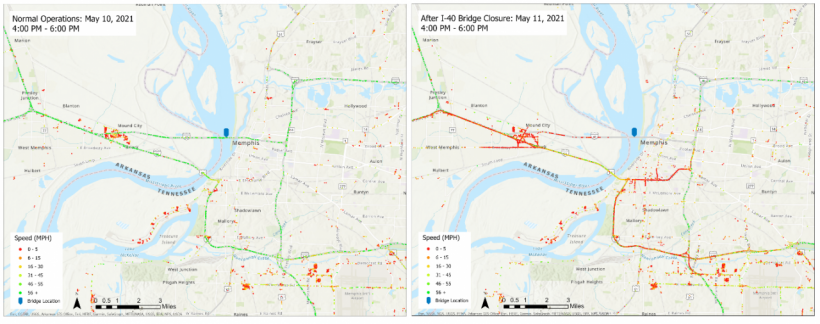
On May 11, Arkansas DOT bridge inspectors discovered a crack in the structure of the De Soto Bridge on I-40 over the Mississippi River. The Tennessee DOT closed the bridge between Memphis, TN, and West Memphis, AR, to all traffic. Vehicles are being detoured to the I-55 bridge three miles away, a detour that is creating traffic delays approaching the I-55 bridge from either side as shown below.

Source: American Transportation Research Institute Freight Mobility Initiative
On Tuesday, the U.S. Coast Guard also closed the waterway under the bridge to all vessel traffic. The bridge and waterway closures pose a multimodal freight bottleneck in the heart of the Nation.
Memphis a key crossroads for trucking.
The I-40 bridge and nearby I-55 bridge carry goods between East Coast and the Southwest and between the upper Midwest and the Gulf Coast. East-west truck traffic diverted from the I-40 bridge is now mixing with north-south truck traffic on the I-55 bridge. An example of the many freight flows over the I-55 are shipments by truck between Chicago and St. Louis metropolitan areas to the north and Baton Rouge and New Orleans to the south. As calculated by the BTS Freight Analysis Framework, they weighed an estimated 383.7 million tons valued at $391.8 billion in 2017. These now-mixed flows serve a much wider range of destinations.
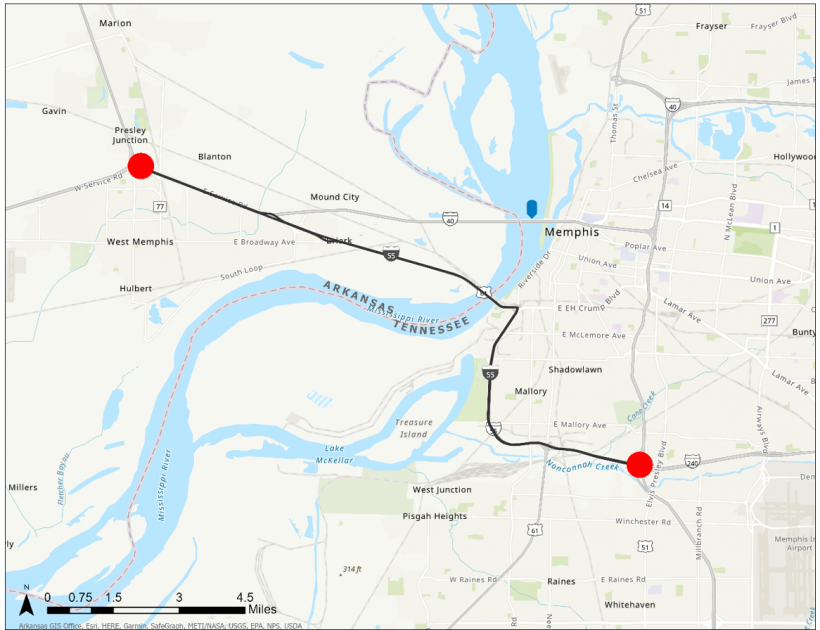
Rerouting traffic from the I-40 crossing to the nearby I-55 bridge is creating significant travel time increases, costing tens of thousands of trucks and commuters each day delays greater than an hour. The single map and table below show travel times on the highway segments where I-40 and I-55 traffic now mix between the junction of I-40 and I-55 in Arkansas and the junction of I-55 and I-69 in Tennessee. The May 12 post-closure morning and afternoon rush-hour travel times of 70-75 minutes compare to a normal 15 minutes as shown below. Traffic that was using I-40 to navigate between the point shown below also had travel times of 15 minutes before that route was closed. As those vehicles become part of the I-55 volume, they will experience the same extensive delay.


Source: American Transportation Research Institute Freight Mobility Initiative
Mississippi River tug and barge traffic delayed.
And, although the Coast Guard reopened the waterway earlier today, the nearly three-day closure resulted in a backup of 62 tugs carrying 1,058 barges. According to the U.S. Army Corps of Engineers, the segment of the Mississippi River passing under the I-40 bridge handles 470,323 short tons each day and 171,667,715 short tons annually. The chart below shows the distribution of commodities that could be disrupted by further waterway closures. (NOTE: 1 short ton = 2,000 pounds.)
Source: BTS analysis of USACE data
Memphis bridges part of national infrastructure challenge.
The I-40 bridge, opened in 1973; it carries more than 35,000 vehicles each day and was most recently rated as being in fair condition with a sufficiency factor of 58%. The I-55 bridge, to which traffic crossing the Mississippi River is being rerouted, opened in 1949; it already carries more than 40,000 vehicles per day and was most recently rated as being in fair condition with a sufficiency rating of 48.5%. Both bridges earned a structural rating of 5 in the most recent National Bridge Inventory.
Less than 44% of the Nation’s 618,456 highway bridges are rated in good condition. More than 45,000 bridges (5.2% of total) are rated as being in poor condition.
Source: BTS National Transportation Statistics Table 1-28 analysis of FHWA National Bridge Inventory
