Increase in Transportation Consumer Price Index Accounts for Nearly 27% of Year-Over-Year Overall CPI Growth; Lowest Share of Inflation Since February 2021
Data spotlights represent data and statistics from a specific period of time, and do not reflect ongoing data collection. As individual spotlights are static stories, they are not subject to the Bureau of Transportation Statistics (BTS) web standards and may not be updated after their publication date. Please contact BTS to request updated information.
When the prices of goods and services rise, inflation causes concern because it erodes consumers’ purchasing power. Inflation includes the prices faced by consumers for transportation, as measured by the Consumer Price Index (CPI) for items such as motor vehicles, gasoline, and airfares. It also includes the transportation costs, as measured in the Producer Price Index (PPI), that manufacturers, wholesalers, and retailers pass onto consumers in the prices they charge for their goods and services.
In September 2022, the overall transportation CPI rose 12.6% from September 2021.[1] That is the lowest year-over-year increase since March 2021.
After steadily increasing since June 2020, the seasonally adjusted transportation CPI declined in 4 of the last 6 months and for the last 3 months in a row. From August to September 2022, it dropped 0.6% (figure 1).
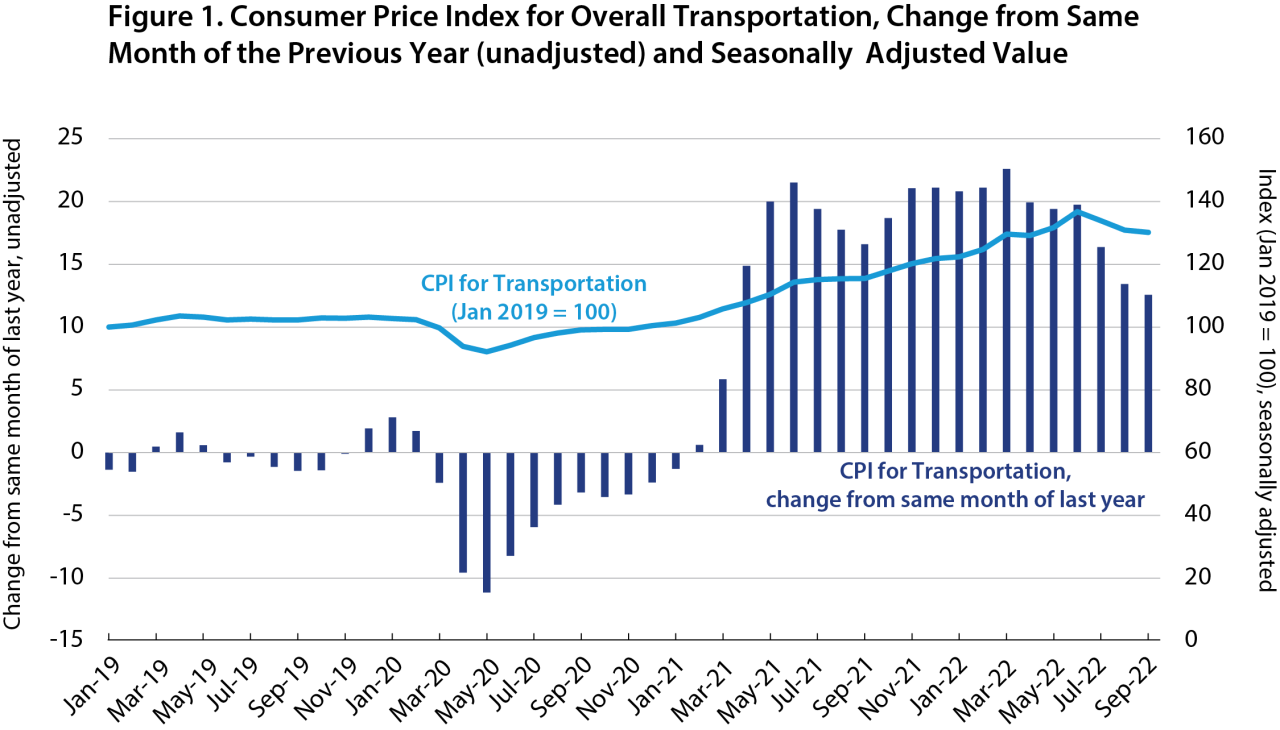
Source: U.S. Department of Labor, Bureau of Labor Statistics, All Urban Consumers (Current Series), Seasonally Adjusted, US City Average, CUSR0000SAT, and Unadjusted, US City Average, CUUR0000SAT available at https://www.bls.gov/cpi/data.htm
The transportation CPI is the official measure of the price paid by consumers for transportation goods and services over time and hence a measure of inflation. Overall transportation includes private transportation (made up of new and used motor vehicles, motor fuel, motor vehicle parts and equipment, motor vehicle maintenance and repair, motor vehicle insurance, and motor vehicle fees) and public transportation (made up of airline fares, other intercity transportation, intracity transportation, and public transportation).
Vehicle ownership and operating costs primarily contribute to transportation inflation. The CPI for new vehicles and used vehicles has risen in recent months.[2] Supply chain issues slowed the production of new vehicles and increased demand for used vehicles. The CPI for used vehicles in September 2022 was 7.2% above the same month last year, and the CPI for new vehicles in September 2022 was 9.4% above the same month last year. At the same time, the car and truck rental CPI fell 1.4% from September 2021 to September 2022 but rose 2.5% from August to September 2022.
Operating costs also are steadily rising. Among operating costs, the CPI for motor fuels rose the most year-over-year; gasoline was up 18.2% and other motor fuels were up 49.0% in September 2022. However, the CPI for gasoline declined 4.9% and other motor fuels declined 2.1% from August 2022, both for the third month in a row. Other operating costs also grew compared to the same month last year but by less than gas and other motor fuels:
Motor vehicle parts and equipment were up 13.4%,
Motor vehicle maintenance and repair were up 11.1%,
Motor vehicle insurance was up 10.3%, and
Motor vehicle fees (state and local registration and licensing and parking fees) were up 2.7%.
Overall, transportation contributed 26.7% to the rise in prices from September 2021 to September 2022, falling for the sixth consecutive month (figure 2) to its lowest share since February 2021. Gasoline accounted for the largest contribution — 8.2% of the change in the price of all items from September 2021 to September 2022 (figure 3). From March 2021 to July 2022, transportation collectively accounted for one-third or more of the year-over-year increase in prices, with the largest contribution occurring in June 2021. In June 2021, transportation contributed 58.6% to the year-over-year price increase in all items.
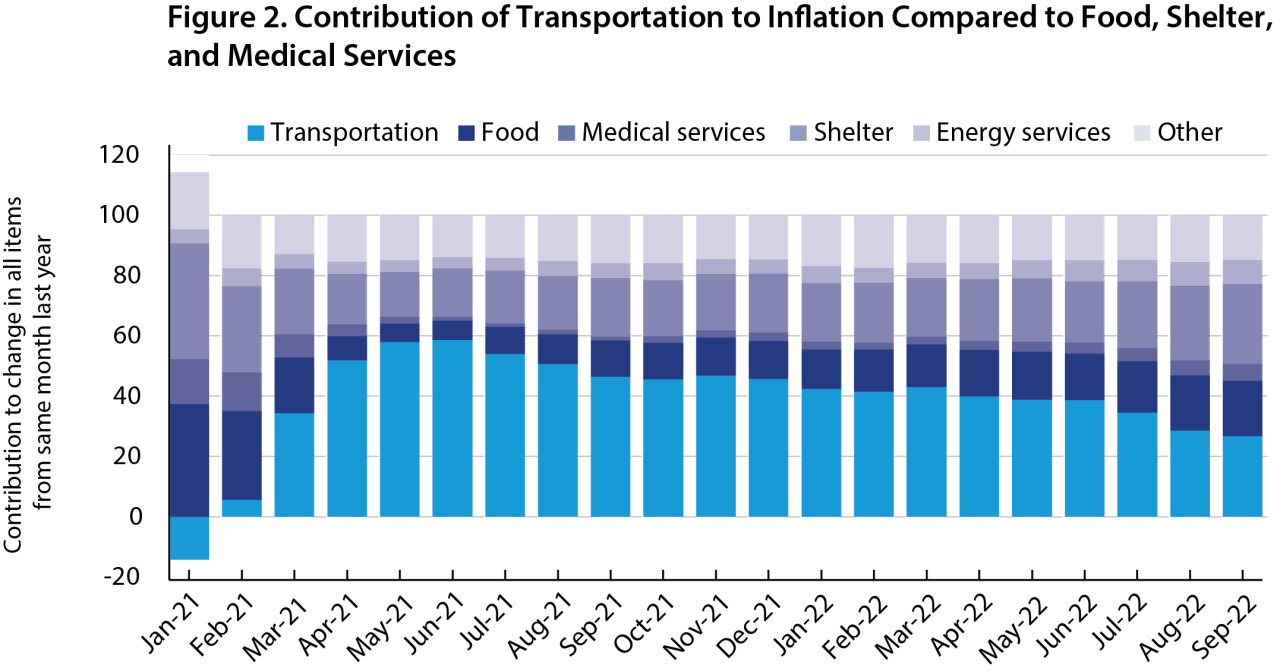
Note: Energy services are services such as electricity and utility (gas) piped service.
Source: U.S. Department of Labor, Bureau of Labor Statistics, All Urban Consumers (Current Series), Unadjusted, US City Average, news release table 7, available at https://www.bls.gov/bls/news-release/cpi.htm
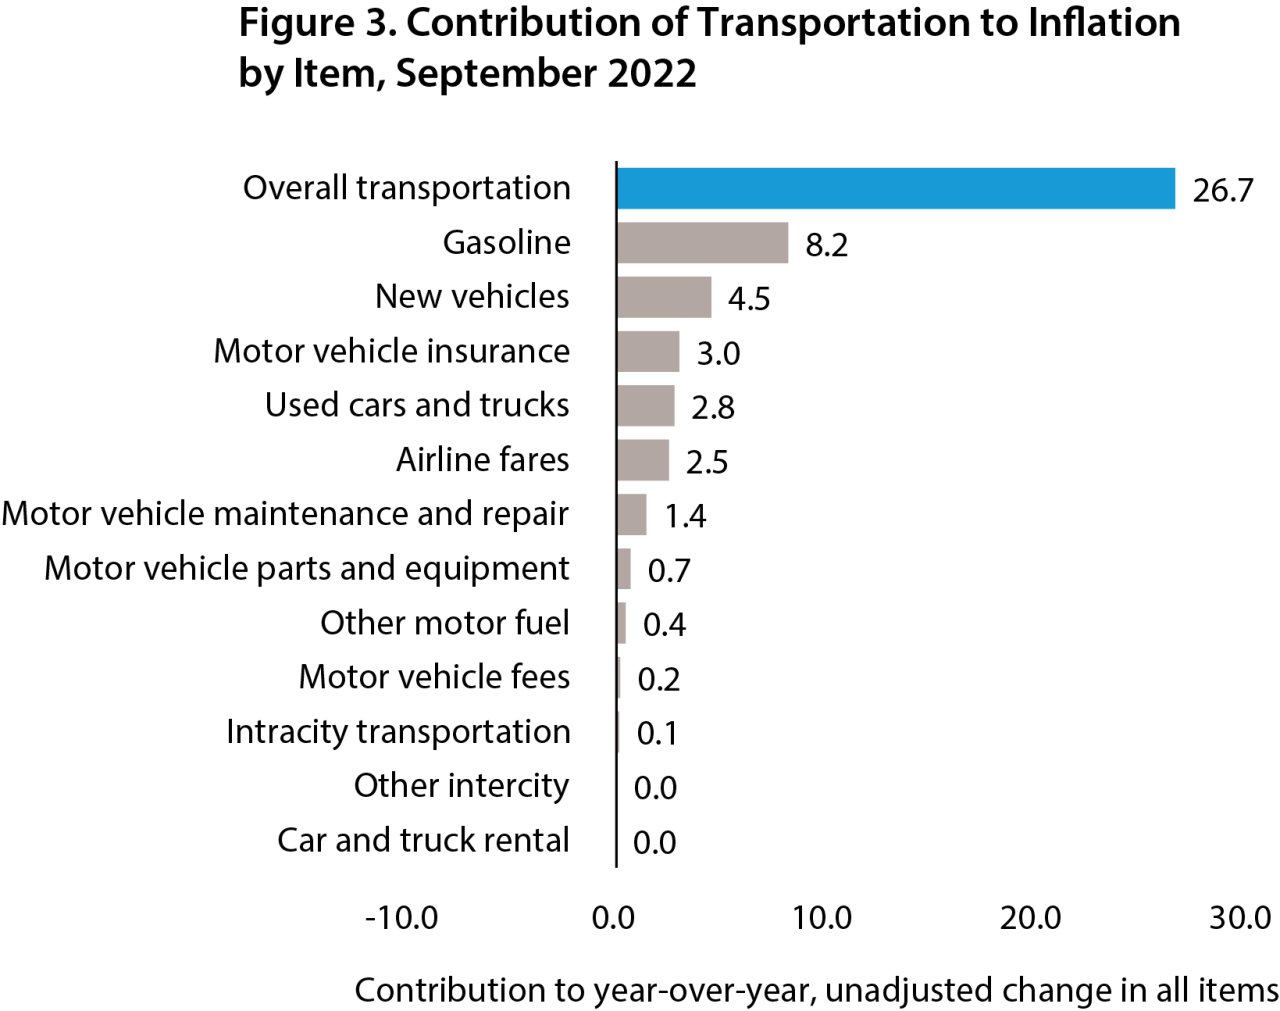
Source: U.S. Department of Labor, Bureau of Labor Statistics, All Urban Consumers (Current Series), Unadjusted, US City Average, news release table 7, available at https://www.bls.gov/bls/news-release/cpi.htm
While the transportation CPI and many of its components remain above their level from the same month last year, several remained at the same level or declined in September 2022 from the previous month, showing encouraging signs that transportation inflation could be slowing.
Transportation Costs Faced by Producers of Products
The PPI measures inflation from the perspective of producers of products. When producers face higher production costs (input inflation), they often pass the increases onto retailers and consumers, which is seen in increases in the CPI.
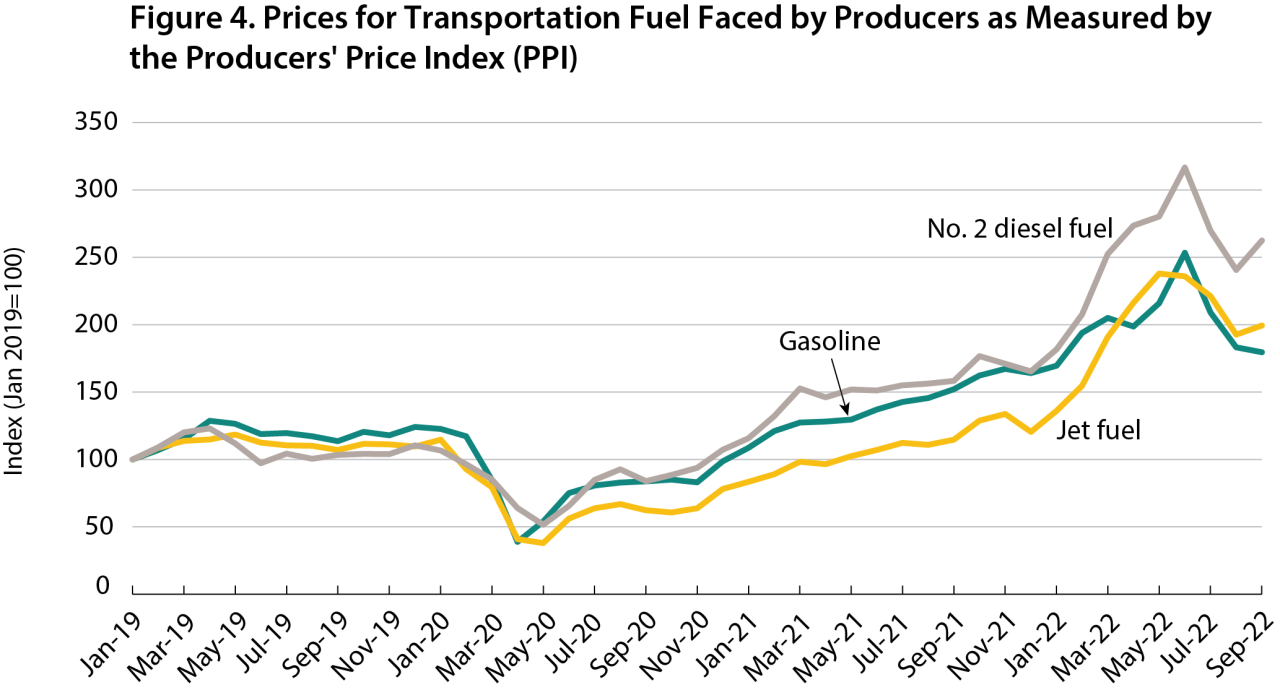
Producers faced higher prices, as measured by the PPI, for all fuel and equipment items in September 2022 than in September 2021. Fuel rose the most, with a 73.9% increase in jet fuel and a 65.9% increase in diesel fuel (figure 4). Across transportation equipment, the price of truck trailers increased the most (32.0%) followed by truck and bus bodies at (15.6%) (figure 5). Prices for diesel fuel rose from August to September 2022 by 9.1% but by significantly less than the year-over-year increase.
Contrastingly, price increases for transportation equipment have slowed; they remained the same or rose slightly from August to September 2022. Overall, prices for fuel and equipment are above their January 2019 level, with prices for transportation equipment continuing to climb. Transportation fuel shows a mixed trend after reaching a high in June 2022, with gasoline continuously declining from that high, while jet and diesel fuel declined and then rose in September 2022.
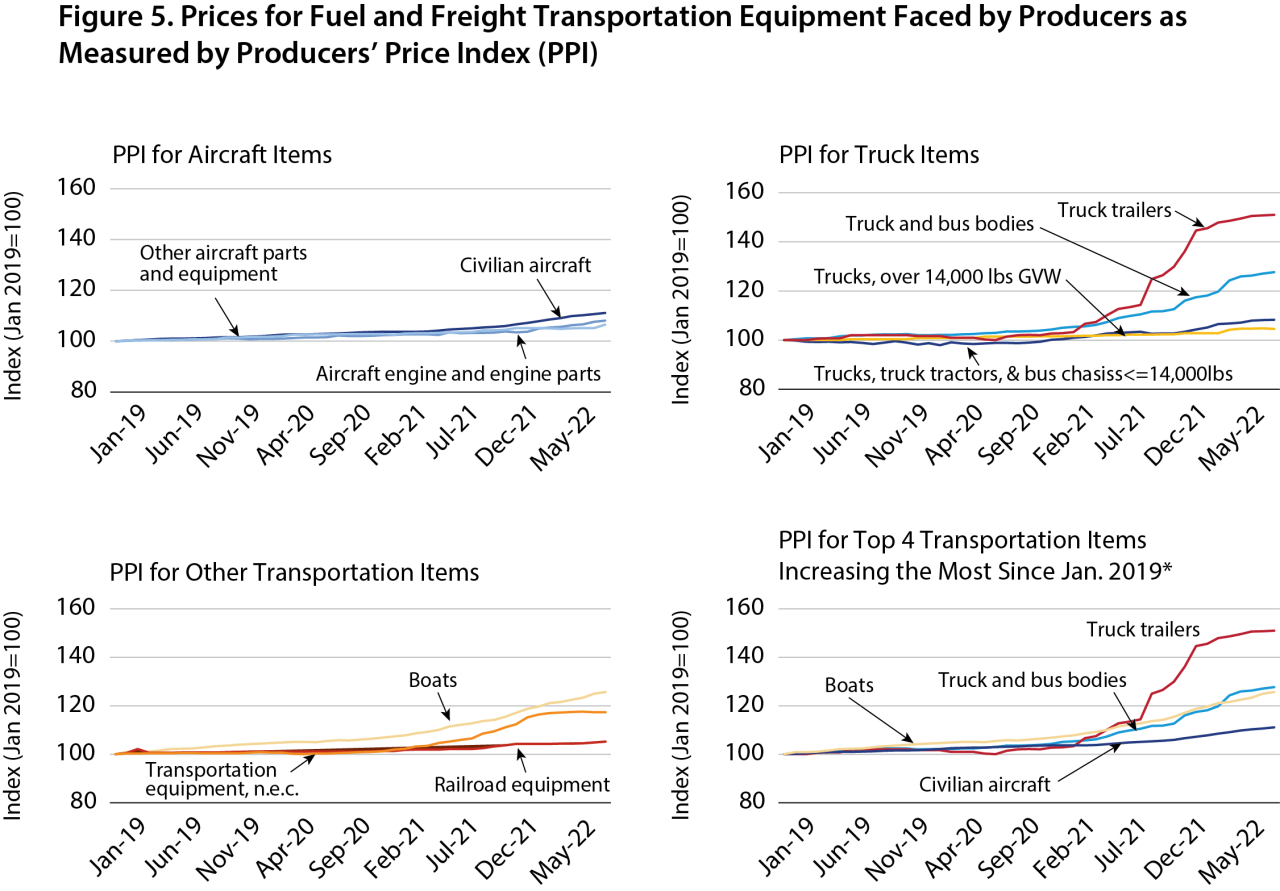
*Excluding transportation equipment, n.e.c
Note: The series trucks, truck tractors, and bus chassis 14,000 lbs. or less, incl. minivans and SUVs; civilian aircraft; aircraft engine and engine parts; other aircraft parts and equipment; and boats are seasonally adjusted. The series jet fuel, trucks, over 14,000 lbs.; truck and bus bodies; truck trailers; railroad equipment; and transportation equipment, n.e.c. are not seasonally adjusted.
Source: U.S. Department of Labor, Bureau of Labor Statistics, Producer Price Index (Current Series), WPS057303, WPS141105, WPS142102, WPS1423, WPS1425, and WPS1432 (seasonally adjusted) and WPU057203, WPU057303, WPU141106, WPU1413, WPU141406, WPU144, and WPU149 (not seasonally adjusted), available at https://www.bls.gov/ppi/data.htm
Producers faced higher prices for freight and related transportation services in September 2022 than in the same month last year, except the arrangement of freight and cargo, which declined 16.7%. The price for water transportation of freight increased the most, at 27.9%, followed by truck transportation of freight at 16.3% (figure 6). The PPI in nearly every category decreased from August to September 2022 with producers seeing little to no increase (1.5% or less) in prices for freight and transportation related services month-over-month. But, overall, prices have risen since January 2019 with the largest increase in the arrangement of freight and cargo (48.2% increase from January 2019 to September 2022).
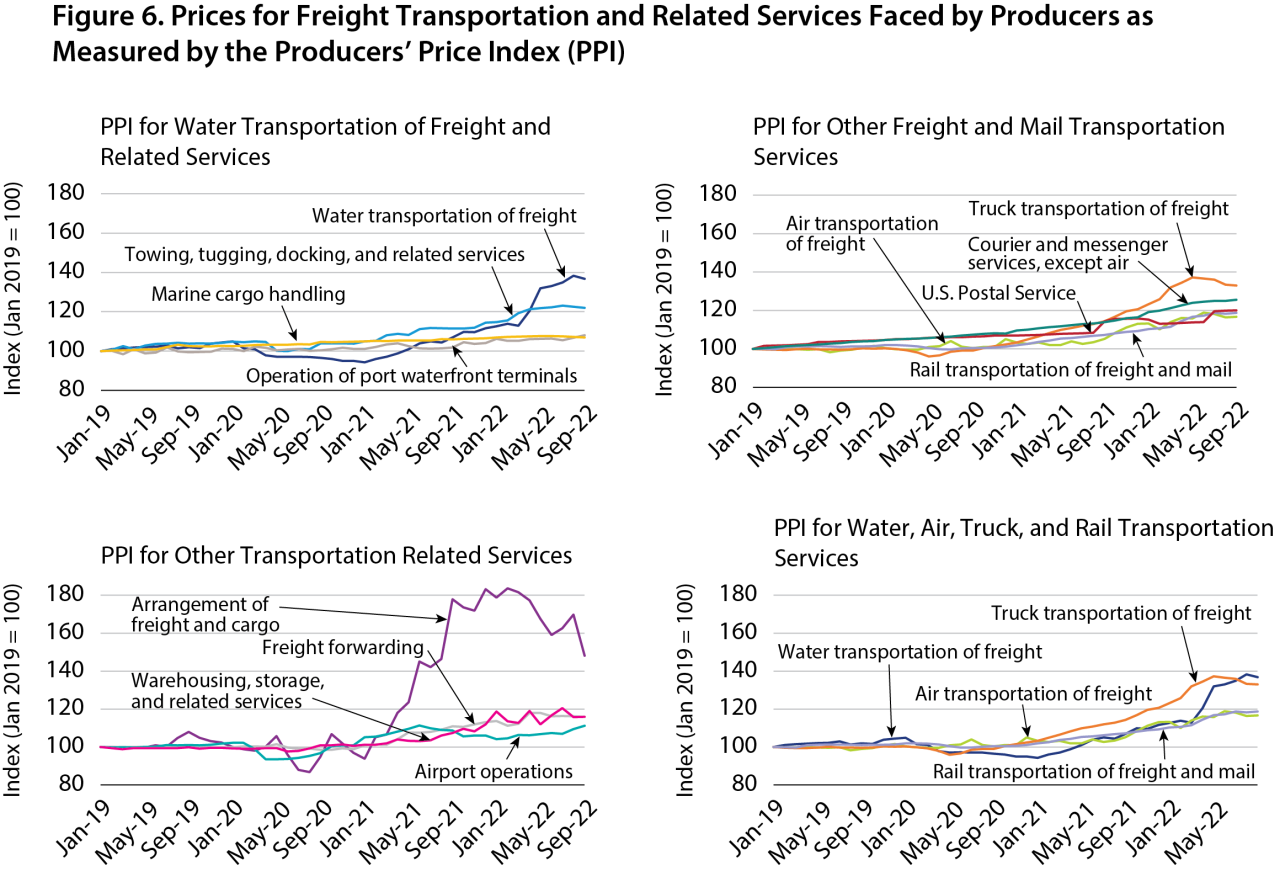
Note: The series U.S. postal services, courier and messenger services (except air), marine cargo handling, and airport operations (except maintenance and repair) are seasonally adjusted. The series air transportation of freight, truck transportation of freight, rail transportation of freight and mail, water transportation of freight, arrangement of freight and cargo, freight forwarding, towing, tugging, docking, and related services, and operation of port waterfront terminals are not seasonally adjusted.
Source: U.S. Department of Labor, Bureau of Labor Statistics, Producer Price Index (Current Series), WPS301601, WPS301602, WPS3113, and WPS3121 (seasonally adjusted) and WPU3011, WPU3012, WPU3013, WPU3014, WPU3131, WPU3132, WPU3211, WPU3111, and WPU3112 (not seasonally adjusted) available at https://www.bls.gov/ppi/data.htm
Transportation and related services accounted for 11.6% of the year-over-year increase in the price for all services purchased by producers of goods and services, its lowest share since August 2021 (figure 7). Truck transportation of freight accounted for the largest share of the change in prices for services purchased by producers (3.4%) (figure 8).
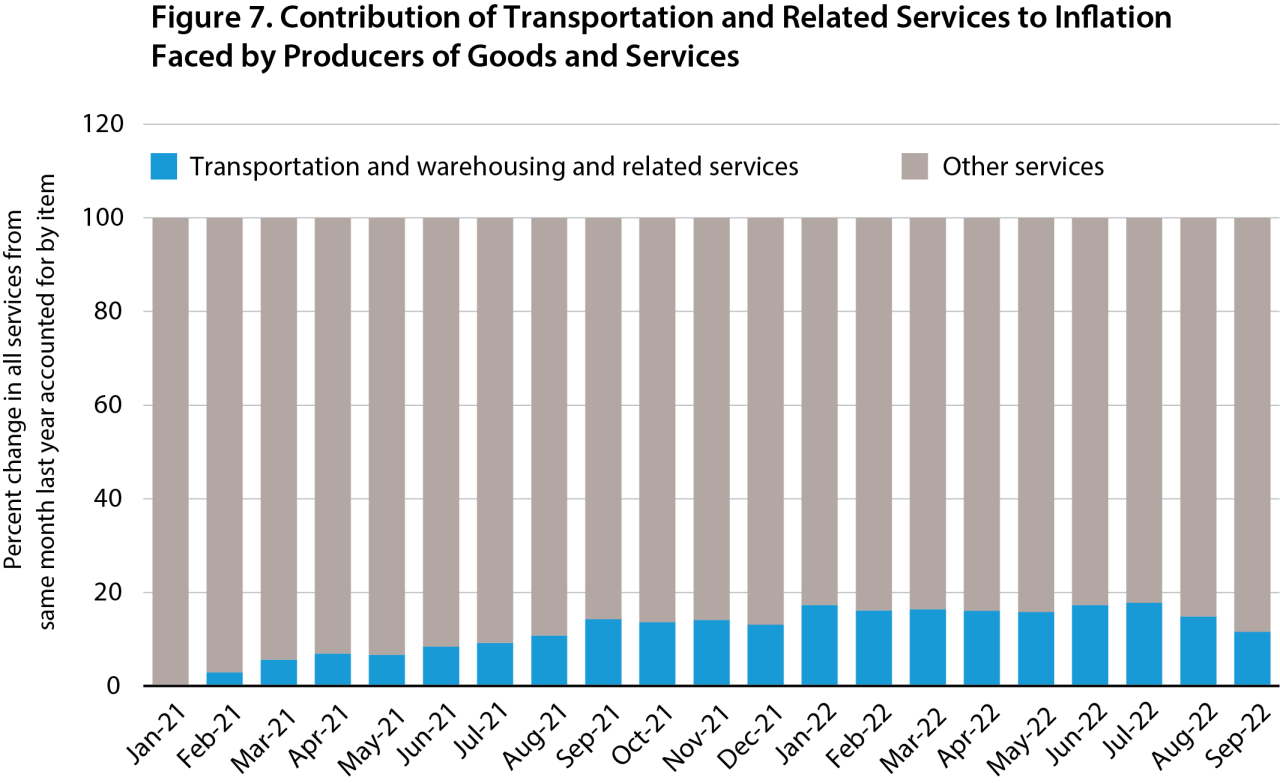
Note: Includes: air transportation of freight, airline passenger services, rail transportation of freight and mail, rail transportation of passengers, truck transportation of freight, courier and messenger services (except air), U.S. postal service, arrangement of freight and cargo, marine cargo handling, operation of port waterfront terminals, airport operations (excluding aircraft maintenance and repair), towing, tugging, docking, and related services, freight forwarding, warehousing, storage, and related services purchased by industries to produce output.
Source: U.S. Department of Transportation, Bureau of Transportation Statistics’ calculations from U.S. Department of Labor, Bureau of Labor Statistics, Producer Price Index (Current Series), Unadjusted WPU301601, WPU301602, WPU3021, WPU3022, WPU3011, WPU3012, WPUFD42, WPU3131, WPU3132, WPU3211, WPU3111, WPU3112, WPU3113, and WPU3121, available at https://www.bls.gov/ppi/data.htm
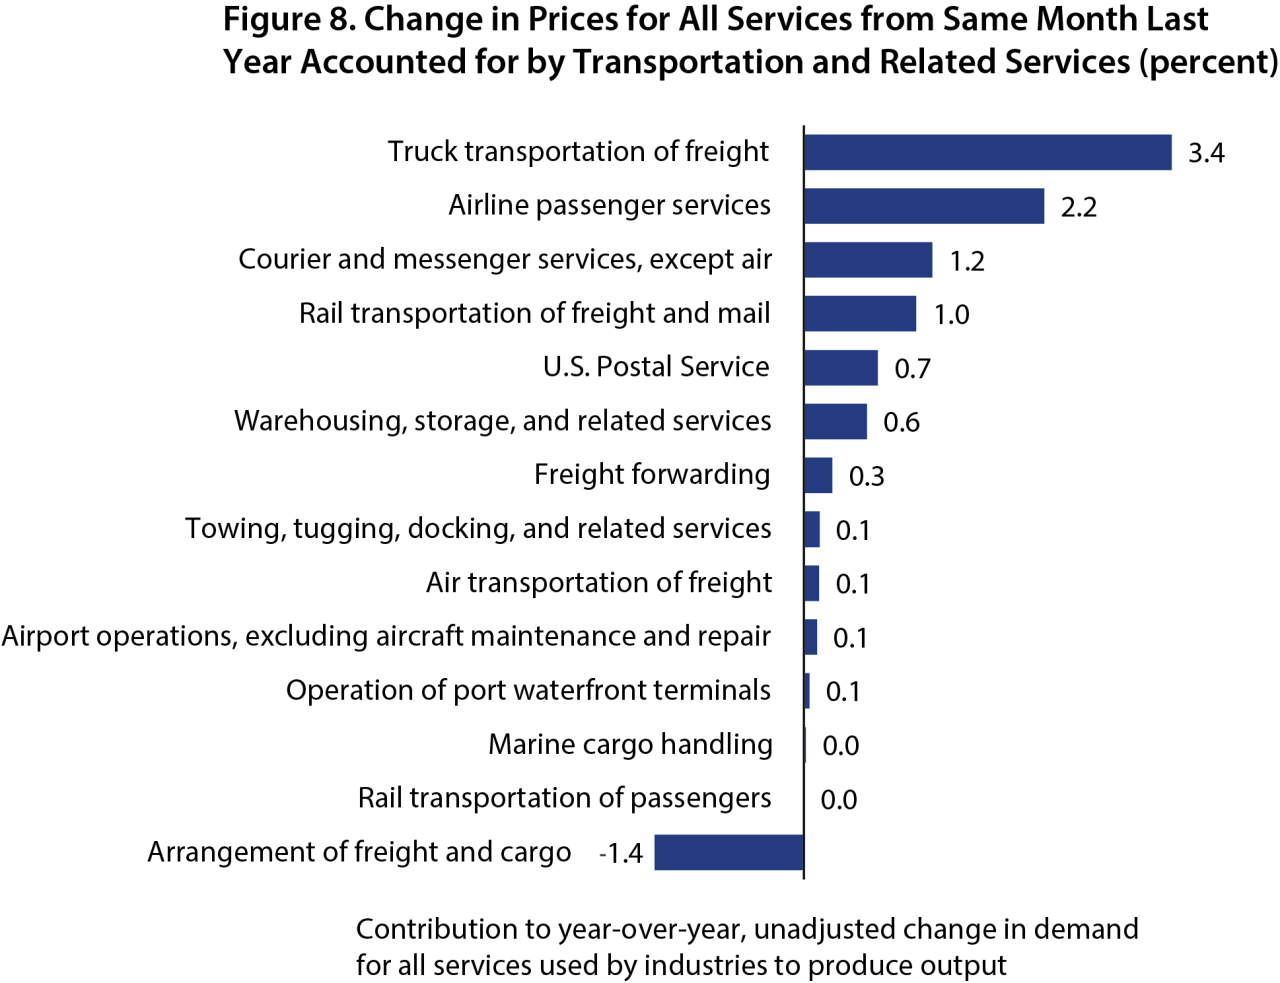
Source: U.S. Department of Transportation, Bureau of Transportation Statistics’ calculations from U.S. Department of Labor, Bureau of Labor Statistics, Producer Price Index (Current Series), Unadjusted WPU301601, WPU301602, WPU3021, and WPU3022, WPU3011, WPU3012, and WPUFD42, available at https://www.bls.gov/ppi/data.htm
Learn more at the Bureau of Transportation Statistics’ (BTS) new interactive Transportation and Inflation visualizations. Data are available by month.
[1] When looking at change from the same month of the previous year, the Bureau of Labor Statistics reports the unadjusted change in the CPI because same month comparisons control for seasonal differences in price. When calculating the change from the previous month, the Bureau of Labor Statistics reports the seasonally adjusted value to eliminate calendar-related differences in prices.
[2] The CPI covers consumer vehicles, including: subcompact cars, compact or sporty cars, intermediate cars, full sized cars, luxury or status cars, pickup trucks, vans, and specialty vehicles, including sport/cross utility vehicles.
