Increases in Highway Construction Costs Could Reduce IIJA Funding Allocated to Transportation Up to 40% Over the Next Five Years
Data spotlights represent data and statistics from a specific period of time, and do not reflect ongoing data collection. As individual spotlights are static stories, they are not subject to the Bureau of Transportation Statistics (BTS) web standards and may not be updated after their publication date. Please contact BTS to request updated information.
Higher costs reduce what can be bought with the money allocated by transportation spending bills. The Infrastructure Investment and Jobs Act (IIJA) (Public Law 117-58), includes $673.8 billion in transportation funding for roads, bridges, transit, airports, ports, and rail. Of that $673.8 billion, the largest share ($379.3 billion, or 56%) is for highway infrastructure, with roughly 20% of the total highway allocation to be distributed in each of the five fiscal years from 2022 through 2026.
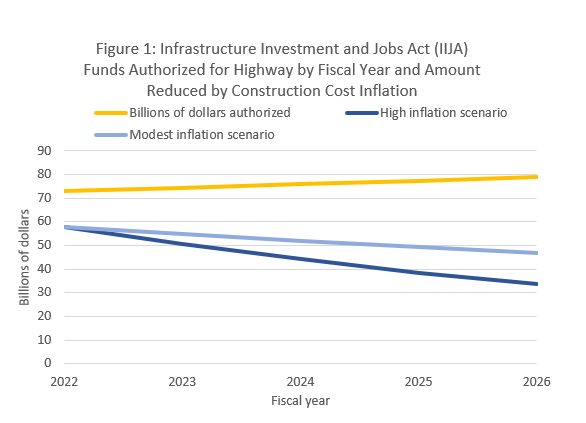
Should highway construction costs rise above their level when IIJA was signed in 2021, what can be bought with the funds in each fiscal year will decline. The following looks at two different scenarios (Figure 1). The first scenario assumes construction costs continue to rise at their current rate using the average annual growth from the last two years (2021 and 2022), called the High Inflation Scenario.1 Under this scenario, only $224.2 billion can be bought with the $379.3 billion allotted for highways. In other words, only 60% of what could have been bought in 2021, when IIJA was signed, can be bought over the five years from 2022 through 2026; that is a 40% reduction.
The second scenario, the Modest Inflation Scenario, assumes a more modest growth in construction costs equal to the average annual growth in 2019 and 2021.2 Under this more modest growth scenario, $260.5 billion can be bought with the $379.3 billion allocated for highways due to increased highway construction costs. This is 16% more than what could be bought if highway construction costs continue to rise at their current higher rate (first scenario) but still only 69% of what could have been bought when IIJA was signed. In other words, a 31% reduction in what could have been constructed in 2021 when highway construction cost less.

Note: High inflation scenario = amount that could be bought with allocated IIJA funding for transportation assuming construction costs continue to grow at the average of the 2019 and 2021 annual growth. Modest inflation scenario = amount that could be bought with allocated IIJA funding for transportation assuming construction costs continue to grow at the average of the 2021 and 2022 annual growth.
Source: Calculations by U.S. Department of Transportation, Bureau of Transportation Statistics from U.S. Department of Transportation, Federal Highways Administration, National Highway Construction Cost Index, as featured in U.S. Department of Transportation, Bureau of Transportation Statistics, Transportation Economic Trends, Value of Transportation Infrastructure and Other Assets: National Highway Construction Cost Index, available at https://data.bts.gov/stories/s/9kj8-x76q/ as of November 2023 and U.S. Department of Transportation, Bureau of Transportation Statistics’ Transportation Economic Trends, Transportation Funding in the Infrastructure Investment and Jobs Act, available at https://data.bts.gov/stories/s/cvki-zubk as of November 2023.
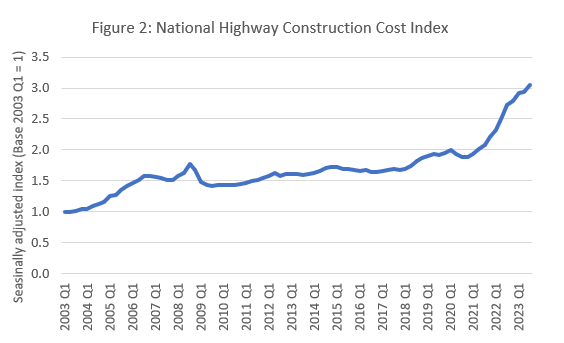
What can be bought today with IIJA funds allocated to transportation in 2021 is significantly less than the dedicated amount due to recent, unprecedented increases in highway construction costs. Highway construction costs rose an unprecedented 26% in 2022; significantly more than the previous all-time annual increase of 20% in 2005 (Figure 2).3 The most recent data, through the third quarter of 2023, show continued growth, with construction costs rising 25% from the first quarter of 2022 to the first quarter of 2023 and 5% from the first to the third quarter of 2022. The growth in construction costs reduces the amount of highway infrastructure that can be bought today versus what could have been purchased prior to the price increases. In other words, the same construction project today costs more than yesterday and significantly more than in 2021.

Source: U.S. Department of Transportation, Federal Highways Administration, National Highway Construction Cost Index as featured in U.S. Department of Transportation, Bureau of Transportation Statistics, Transportation Economic Trends, Value of Transportation Infrastructure and Other Assets: National Highway Construction Cost Index, available at https://data.bts.gov/stories/s/9kj8-x76q/ as of April 2024.
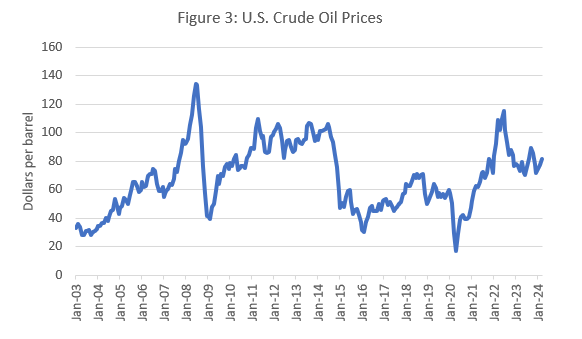
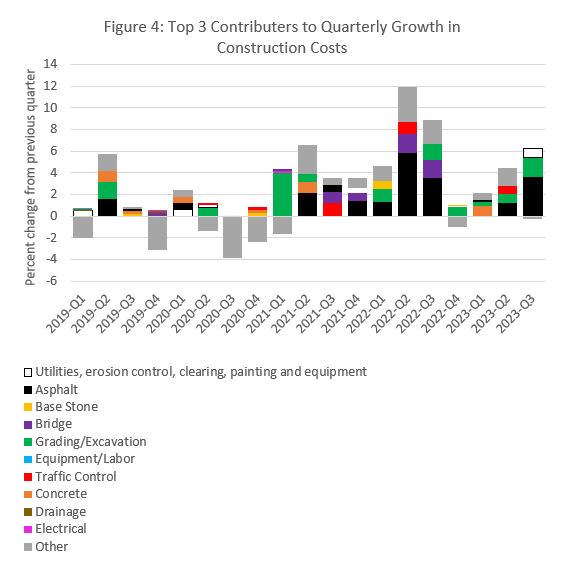
Increases in crude oil, which is used to produce asphalt, contributed to highway construction cost increases. U.S. crude oil increased 594%, from a low of $16.55 per barrel in April 2020 to the second highest price on record of $114.84 per barrel in June 2022 (Figure 3).4 As a result, asphalt was the top contributor to quarterly increases in the National Highway Construction Cost Index (NHCCI) from the last quarter of 2021 through the third quarter of 2022 (Figure 4). Crude oil prices have fallen since the June 2022 high but have risen steadily since the beginning of 2024 (Figure 3), which suggests construction costs may rise further.

Source: Energy Information Administration, Cushing OK WTI Spot Price FOB, available at https://www.eia.gov/dnav/pet/hist/LeafHandler.ashx?n=PET&s=RWTC&f=M as of April 2024.

Note: Total percent change from previous quarter is the sum of all components.
Source: U.S. Department of Transportation, Federal Highways Administration, National Highway Construction Cost Index as featured in U.S. Department of Transportation, Bureau of Transportation Statistics, Transportation Economic Trends, Value of Transportation Infrastructure and Other Assets: National Highway Construction Cost Index, available at https://data.bts.gov/stories/s/9kj8-x76q/ as of April 2024
Supply chain issues additionally contributed to the rise in highway construction costs. Supply chain issues began in 2020 when COVID-19 caused temporary and permanent business closures and increased demand for durable goods.5 This, in turn, caused material prices to rise. Increases in material prices can be seen through the increase in the producer price index (PPI) for all goods and services. The PPI measures the average change over time in the selling prices received by producers for their commodities and, therefore, the prices faced by businesses purchasing those goods and services. The PPI grew by 51% from April 2020 (the lowest point since May 2016) to a new all-time high in June 2022.6
Construction costs are from the Federal Highways Administration’s National Highway Construction Cost Index (NHCCI) as featured in U.S. Department of Transportation, Bureau of Transportation Statistics, Transportation Economic Trends, Value of Transportation Infrastructure and Other Assets: National Highway Construction Cost Index. The NHCCI measures the change in the prices paid by State transportation departments for roadway construction materials and services over time. The NHCCI includes sales and excise taxes, distribution costs, contractor's mark-up, and other fees paid by State transportation departments for highway construction. The NHCCI is different from the PPI in that the NHCCI measures from the perspective of the buyer (by including taxes, mark-up, and other fees) whereas the PPI measures from the perspective of the seller (and hence does not include taxes, mark-up, and other fees).
Funds allocated for transportation infrastructure in IIJA are from the Bureau of Transportation Statistics’ Transportation Economic Trends page on Transportation Funding in the Infrastructure Investment and Jobs Act.
1 Because growth in a single year can be an outlier, this uses the average of the annual growth rate from two year. While more years could be used, using two ensures more closely following the most recent trend in the data.
2 2020 excluded due to COVID-19 being declared a national emergency on March 13, 2020 and subsequent effects from stay-at-home orders and business closures in many states and supply chain issues caused by the restrictions.
3 Records begin in 2003.
4 The highest price on record, reached in June 2008, is $133.88 per barrel. Records begin in January 1986.
5 U.S. Department of Labor, Bureau of Labor Statistics, Monthly Labor Review, “COVID-19 Causes a Spike in Spending on Durable Goods,” available at https://www.bls.gov/opub/mlr/2021/beyond-bls/covid-19-causes-a-spike-in-spending-on-durable-goods.htm as of November 2023.
6 U.S. Department of Labor, Bureau of Labor Statistics, Producer Price Index, All Commodities (not seasonally adjusted), available at https://www.bls.gov/ppi/ as of November 2023.
