
Live Monitoring of Tanker Vessel Calls at U.S. Ports
Data spotlights represent data and statistics from a specific period of time, and do not reflect ongoing data collection. As individual spotlights are static stories, they are not subject to the Bureau of Transportation Statistics (BTS) web standards and may not be updated after their publication date. Please contact BTS to request updated information.
While the U.S. was a net exporter via vessels of crude oil in 2024, exporting 208 million short tons, we also imported 150 million short tons of crude oil via vessels. Sixty-seven percent of crude oil by value were transported via vessels, compared to other modes.
In 2024, crude oil was imported and exported via vessel at 34 U.S. seaports. There were nine ports located on the East Coast (30.3 million short tons), 14 ports on the Gulf Coast (274.8 million short tons), 10 ports on the West Coast (52 million short tons), and on port in Alaska (1.1 million short tons). The top-three ports were Corpus Christi, TX; Houston, TX; and Long Beach, CA [U.S. Census Bureau 2025].
On Friday, April 4, 2025, there were 15 tanker vessels anchored off the Ports of Long Beach and Los Angeles (Figure 1), with five tanker vessels at berth.
Figure 1. Tankers at Anchor off the Ports of Long Beach and Los Angeles on April 4, 2025.
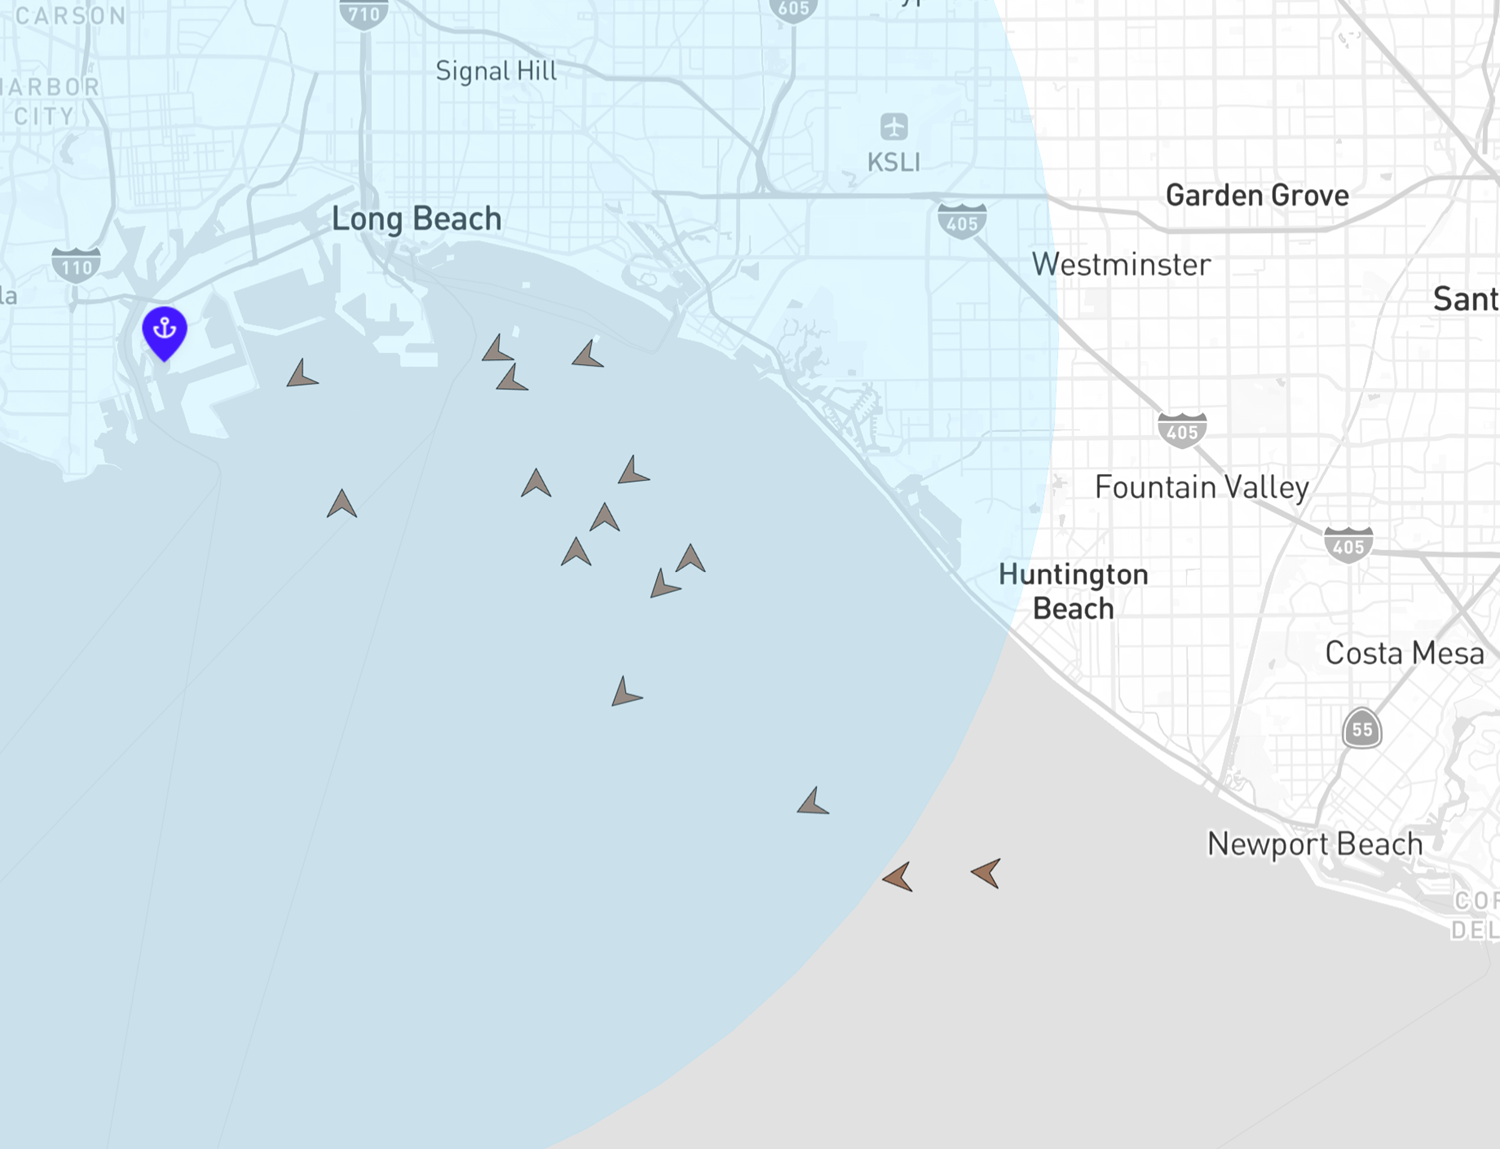
Source: U.S. Department of Transportation Bureau of Transportation Statistics and Trabus Technologies, Waterways Intelligence and Monitoring System (Version 1.0.0). Retrieved from https://wims.trabus.com April 4, 2025.
The number of tankers at anchor by date for January 1, 2025, through April 4, 2025, for the Ports of Long Beach and Los Angeles are illustrated in Figure 2. Both the number of arrivals at anchor and the cumulative total of tankers at anchor per day are provided.
Figure 2. Number of Tanker Vessels at Anchor for the Ports of Long Beach and Los Angeles by Date 1/1/25-4/4/25.
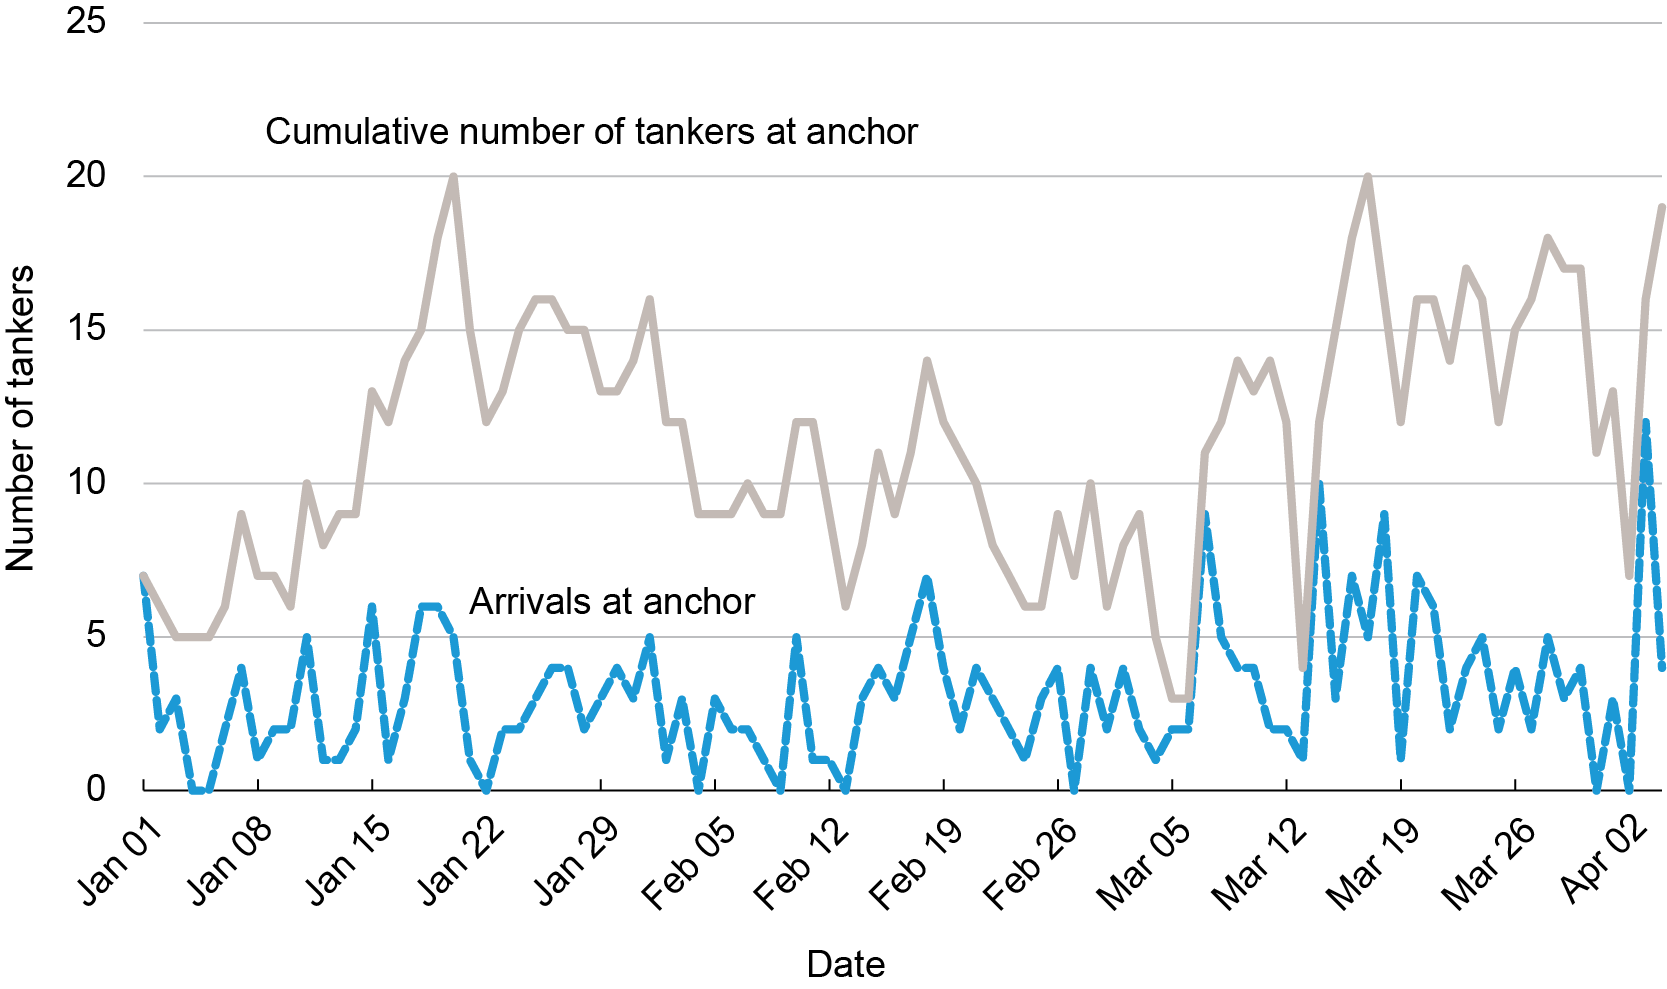
Source: U.S. Department of Transportation Bureau of Transportation Statistics and Trabus Technologies, Waterways Intelligence and Monitoring System (Version 1.0.0). Retrieved from https://wims.trabus.com April 4, 2025.
The average tanker time at anchor by vessel arrival date is shown in Figure 3.
Figure 3. Average Time Spent at Anchor for Tankers for the Ports of Long Beach and Los Angeles by Date 1/1/25-4/4/25.
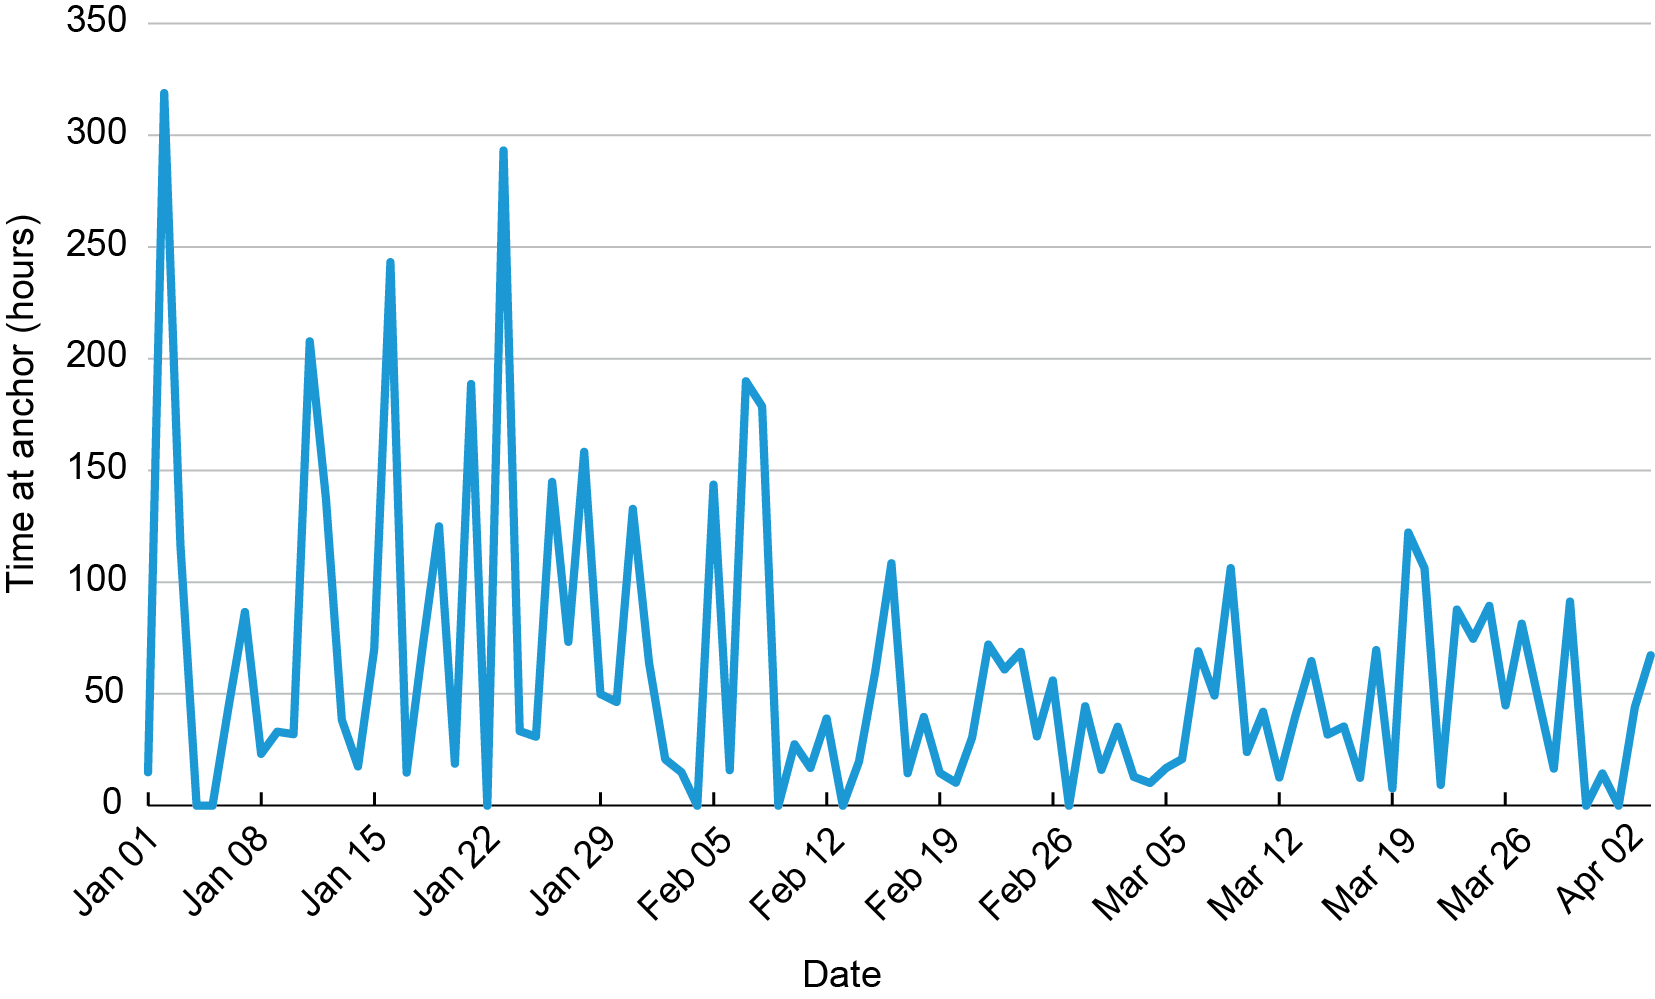
Source: U.S. Department of Transportation Bureau of Transportation Statistics and Trabus Technologies, Waterways Intelligence and Monitoring System (Version 1.0.0). Retrieved from https://wims.trabus.com April 7, 2025.
At the Gulf Coast ports of Port Arthur, TX and Houston, TX, there were eight tanker vessels and 38 tanker vessels at anchor, respectively. On the East Coast, at the Port of New York and New Jersey, there were eight tanker vessels at anchor (U.S. Department of Transportation, 2025).
Figure 4. Tankers at Anchor off the Port of Houston on April 4, 2025.
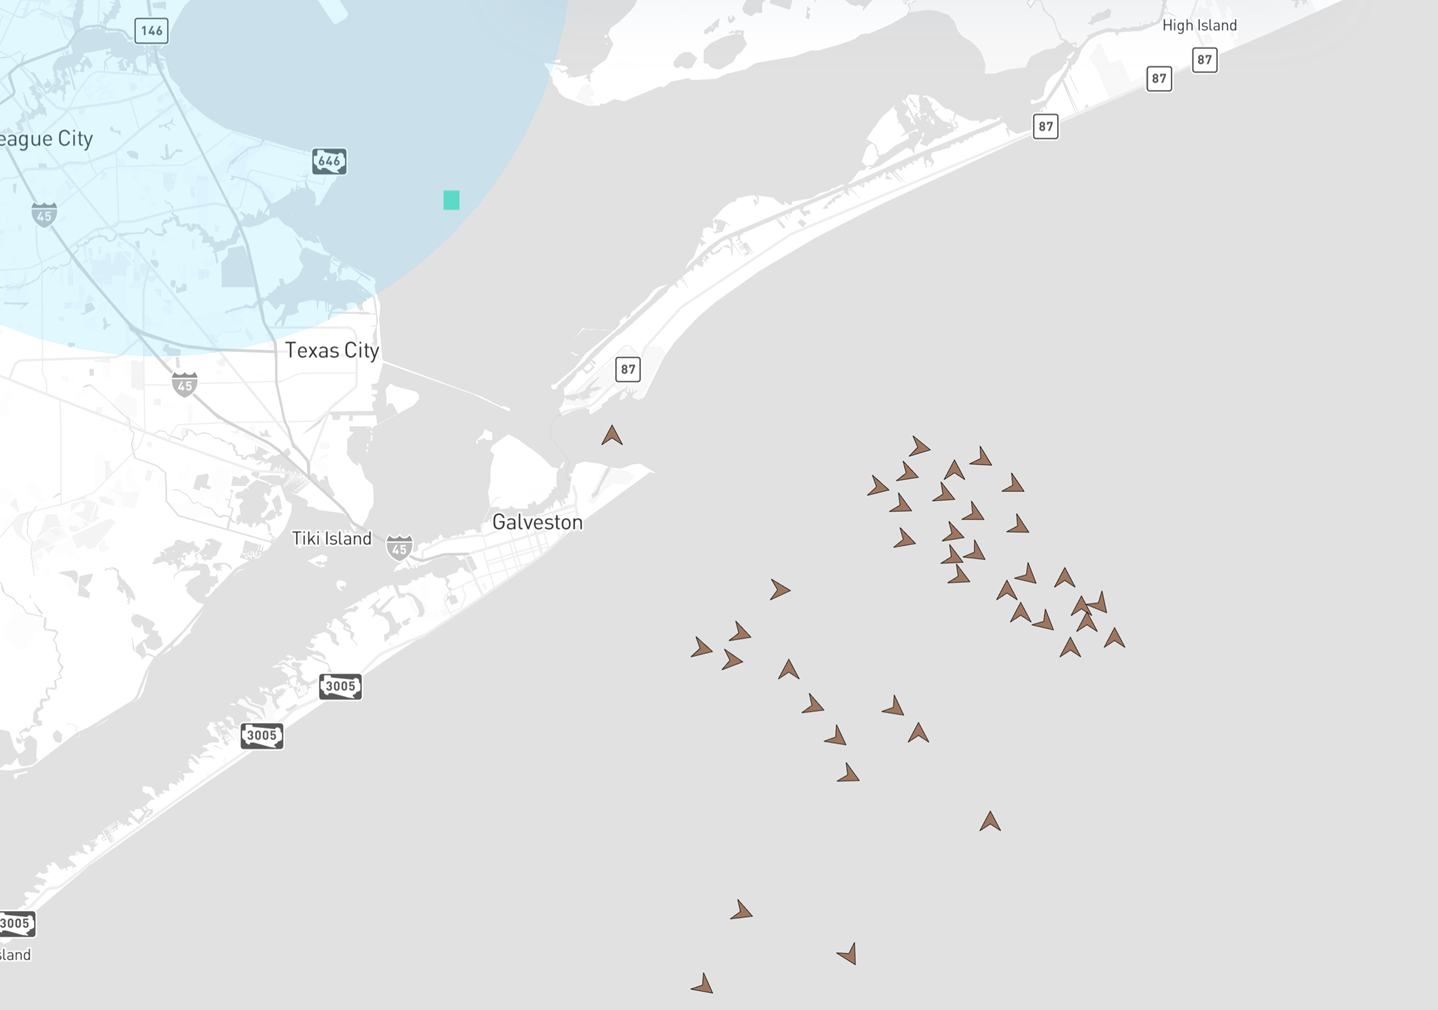
Source: U.S. Department of Transportation Bureau of Transportation Statistics and Trabus Technologies, Waterways Intelligence and Monitoring System (Version 1.0.0). Retrieved from https://wims.trabus.com April 4, 2025.
So far, in 2025, there has been a change in both the number of tankers anchoring at U.S. ports and in the amount of time each tanker remains anchored. The data cited in this spotlight can also be used to track other types of shipping that are important to supply chains. The Port Performance Freight Statistics Program will continue to monitor vessel activity to provide an overview of port throughput and capacity. For more port statistics, visit https://bts.gov/ports.
References:
U.S. Census Bureau. 2025. USA Trade Online. Washington, DC: U.S. Census Bureau. https://usatrade.census.gov/. Last accessed April 2025.
U.S. Department of Transportation Bureau of Transportation Statistics and Trabus Technologies. 2025. Waterways Intelligence and Monitoring System (Version 1.0.0). Washington, DC: Bureau of Transportation Statistics. https://wims.trabus.com. Last accessed April 4, 2025.