
March 2025 Marks Record in value of U.S. Freight with Canada and Mexico
Data spotlights represent data and statistics from a specific period of time, and do not reflect ongoing data collection. As individual spotlights are static stories, they are not subject to the Bureau of Transportation Statistics (BTS) web standards and may not be updated after their publication date. Please contact BTS to request updated information.
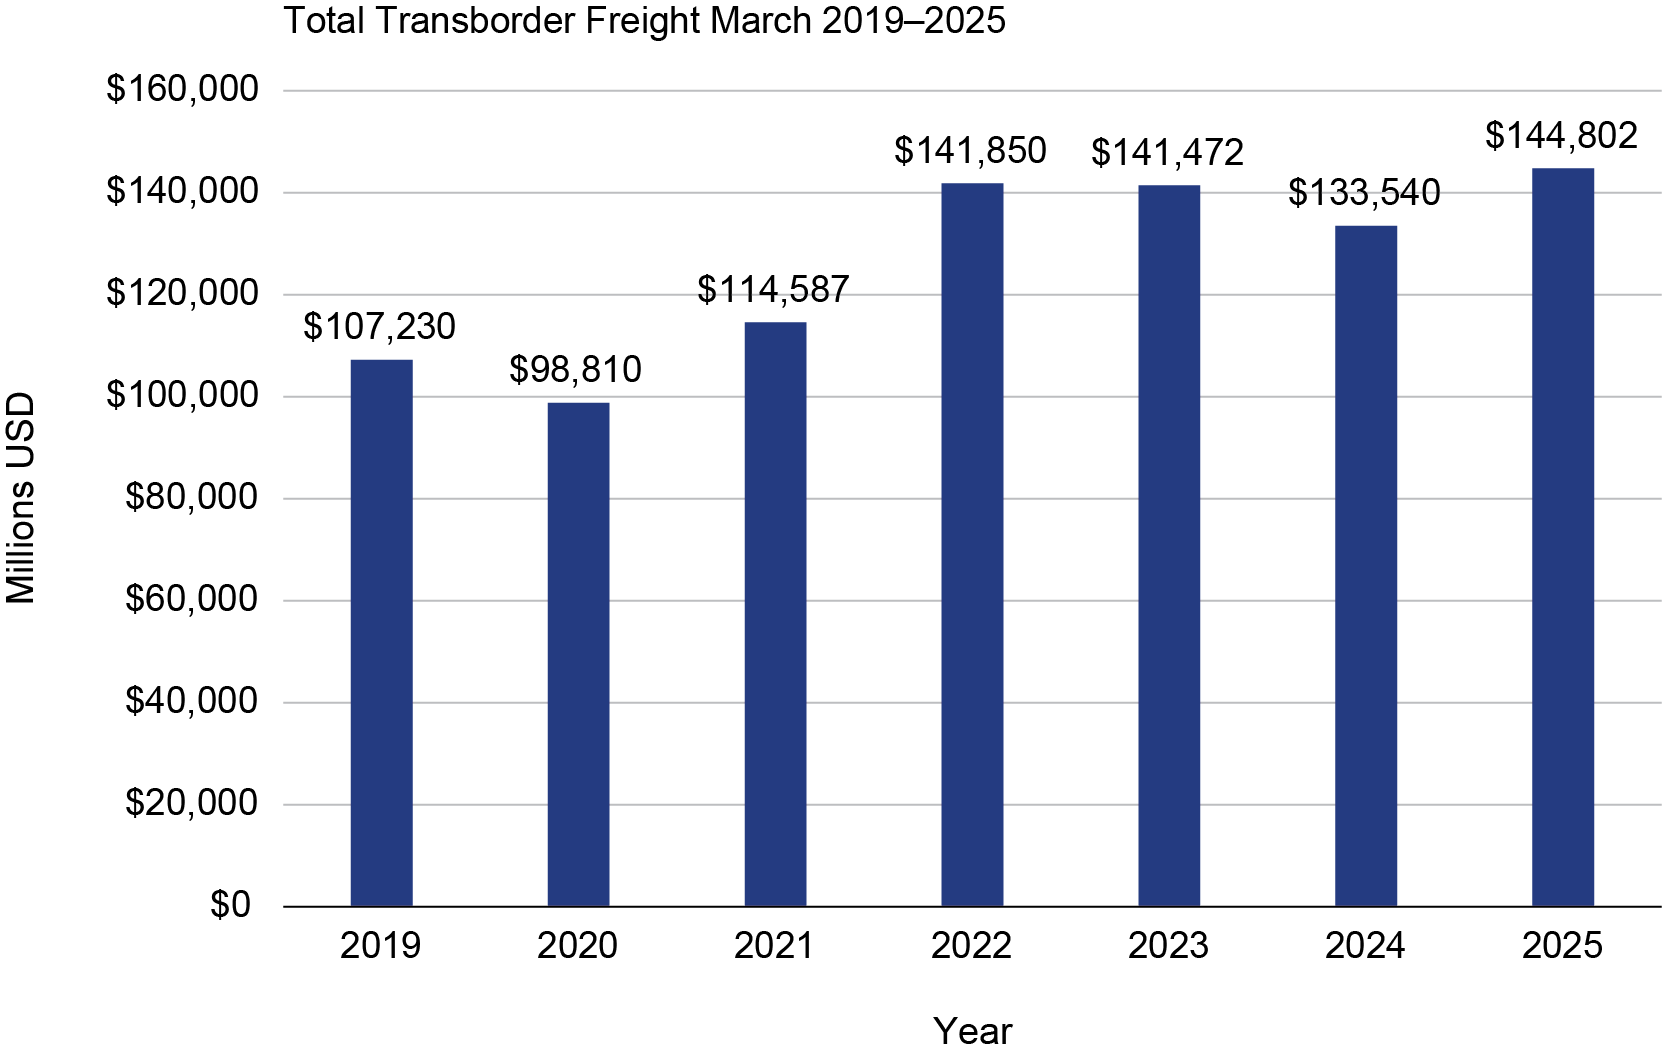
The Bureau of Transportation Statistics TransBorder freight data program reports that March 2025 marks a record all-time high in the monthly dollar value of freight moved by multiple modes of transportation in U.S. freight with Canada and Mexico. Cross border U.S. freight shipments with Canada and Mexico totaled just over $144.8 billion in March 2025. The total represents an 8.4% increase over March 2024 and a 35.0% increase over 2019.
Canada and Mexico regularly conduct over $1 trillion in annual freight flows among them. In 2024, U.S. freight with Canada and Mexico combined totaled $1.6 trillion, a 1.8% increase over 2023.
North America maintains an extensive network of roads, making trucking accessible to a wider range of origins and destinations, including interconnections with warehouse terminals, rail yards, and seaports. This advantage offers shorter transit times, lower transportation costs, and greater flexibility in managing inventory. Canada and Mexico's vast land border with the U.S. offers geographic proximity to US consumers facilitated by a world class intermodal transportation infrastructure.
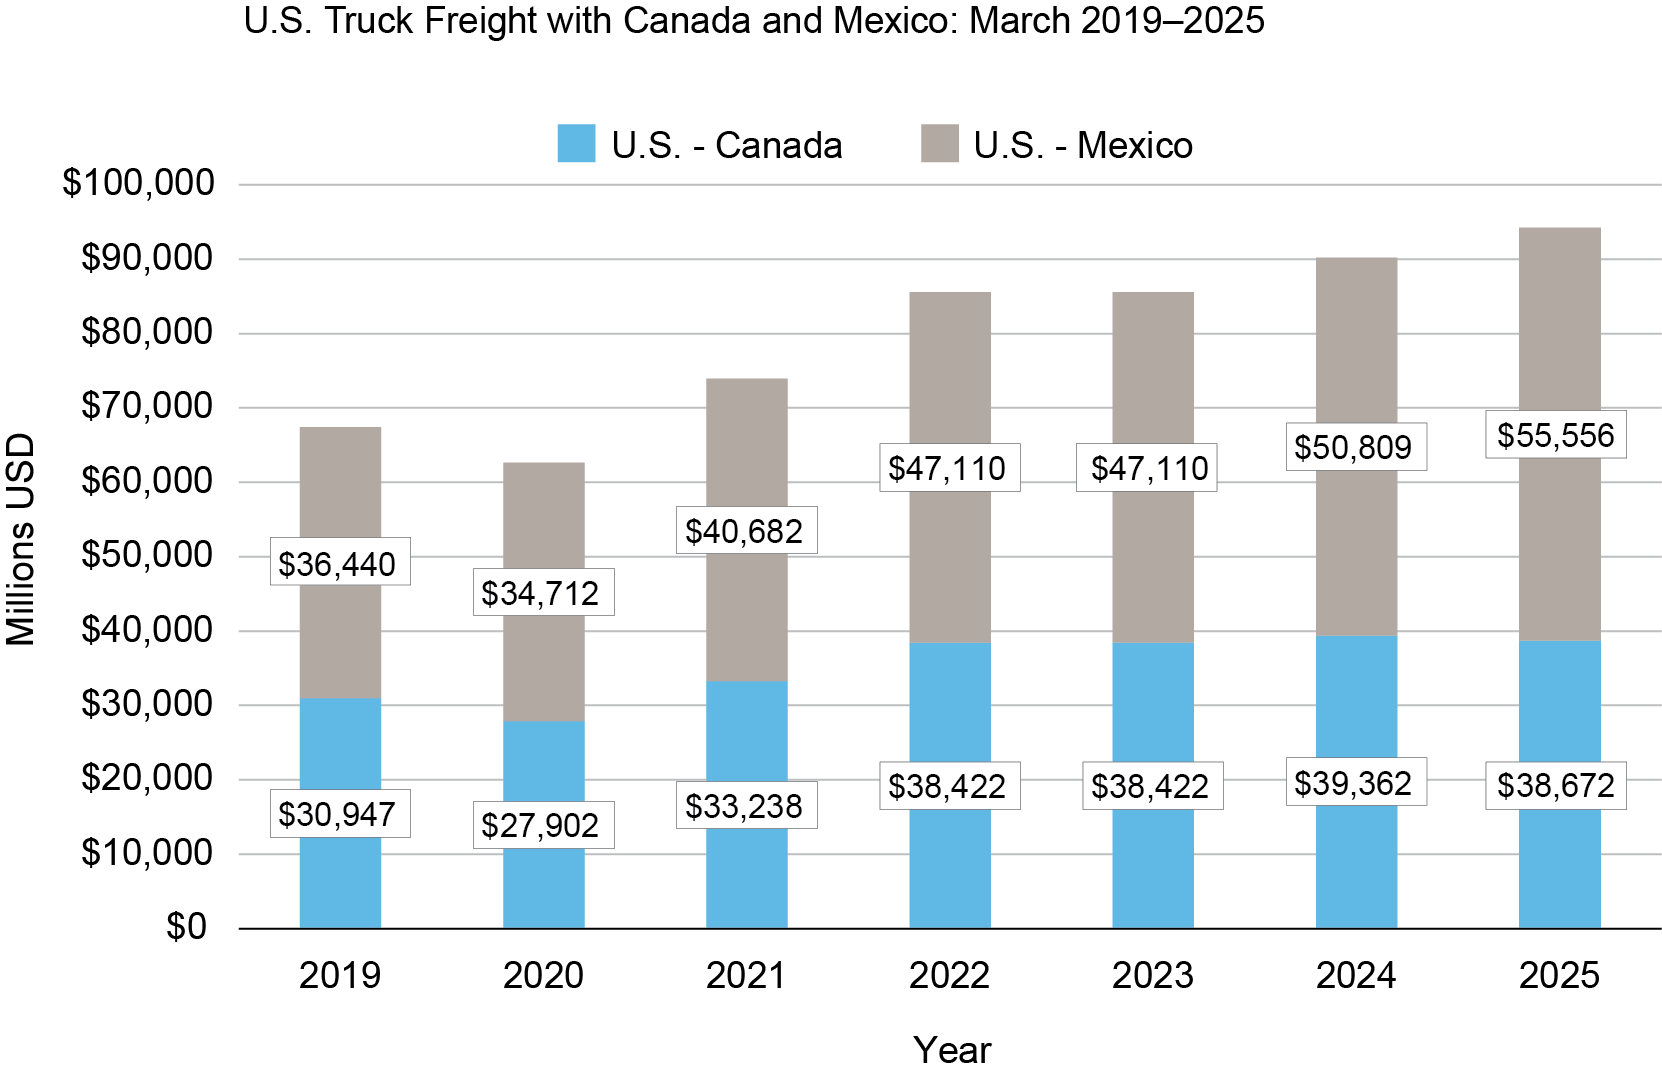
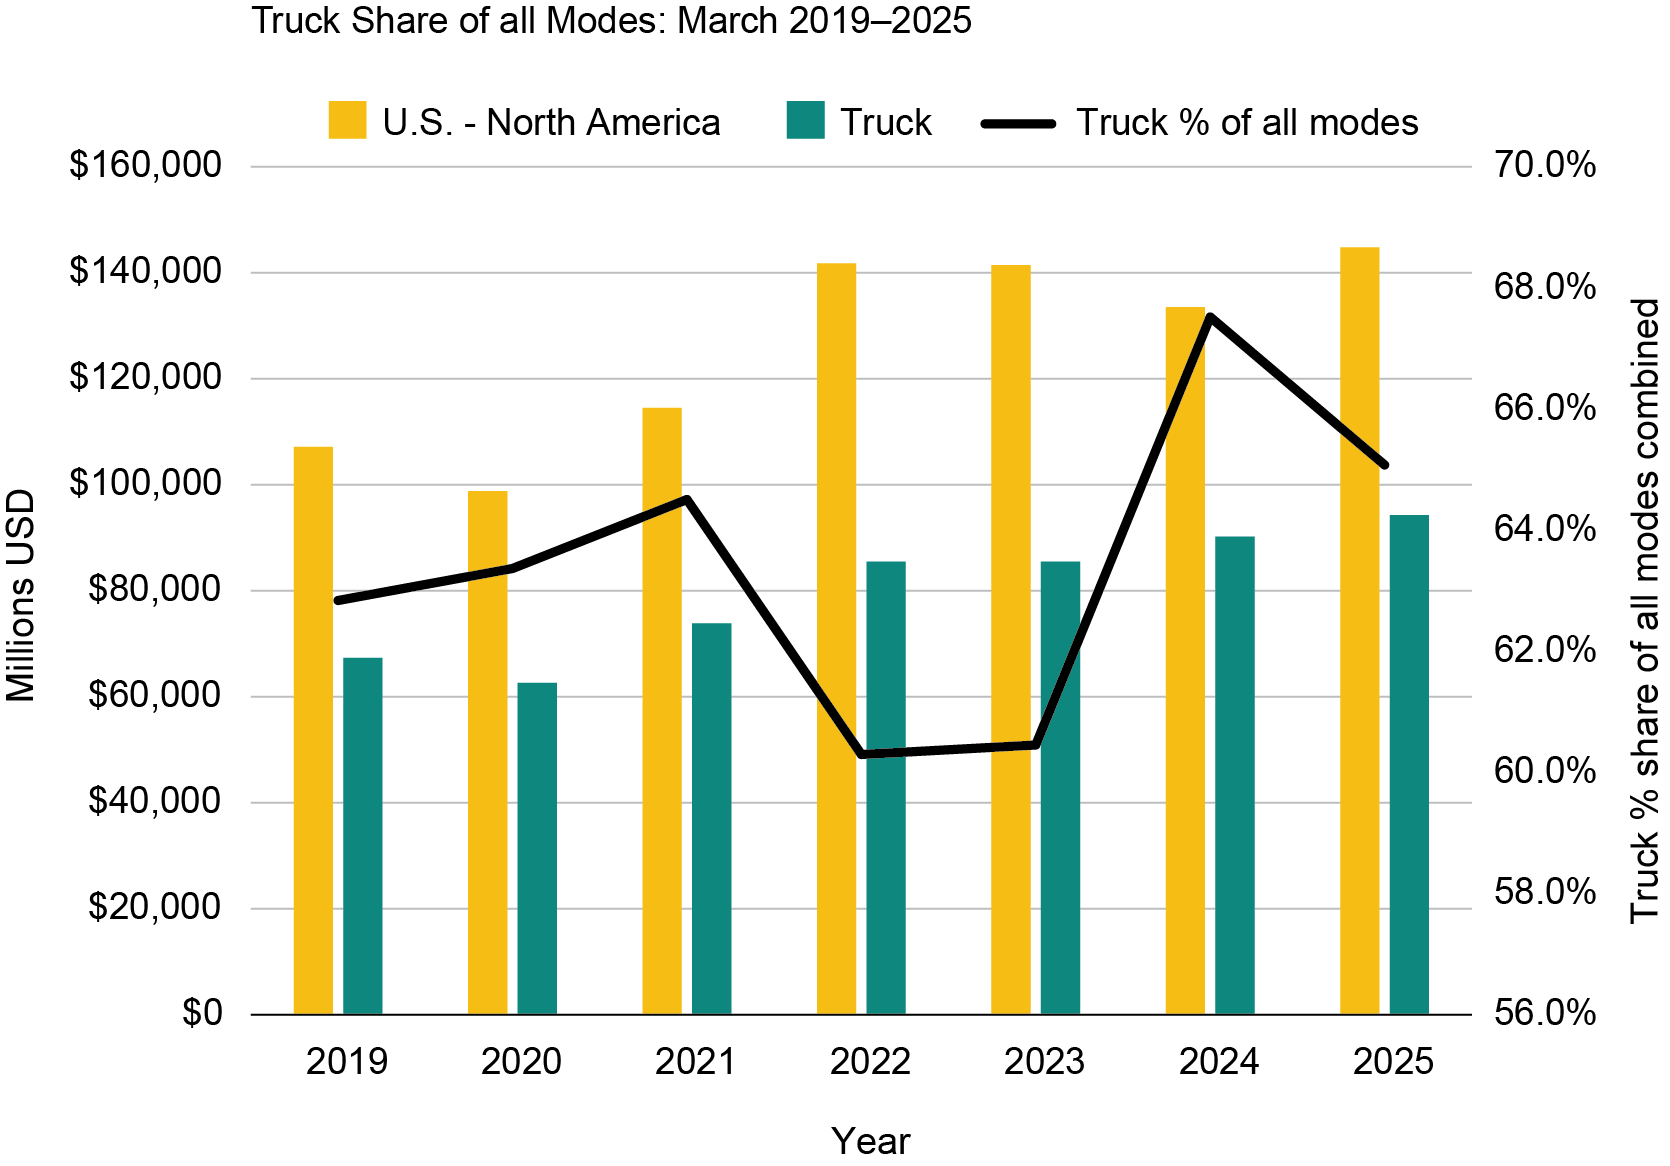
In March 2025, Trucks moved $94.2 billion of freight, 9.5% increase year over year, $67.5 billion with Canada and $77.3 billion with Mexico.
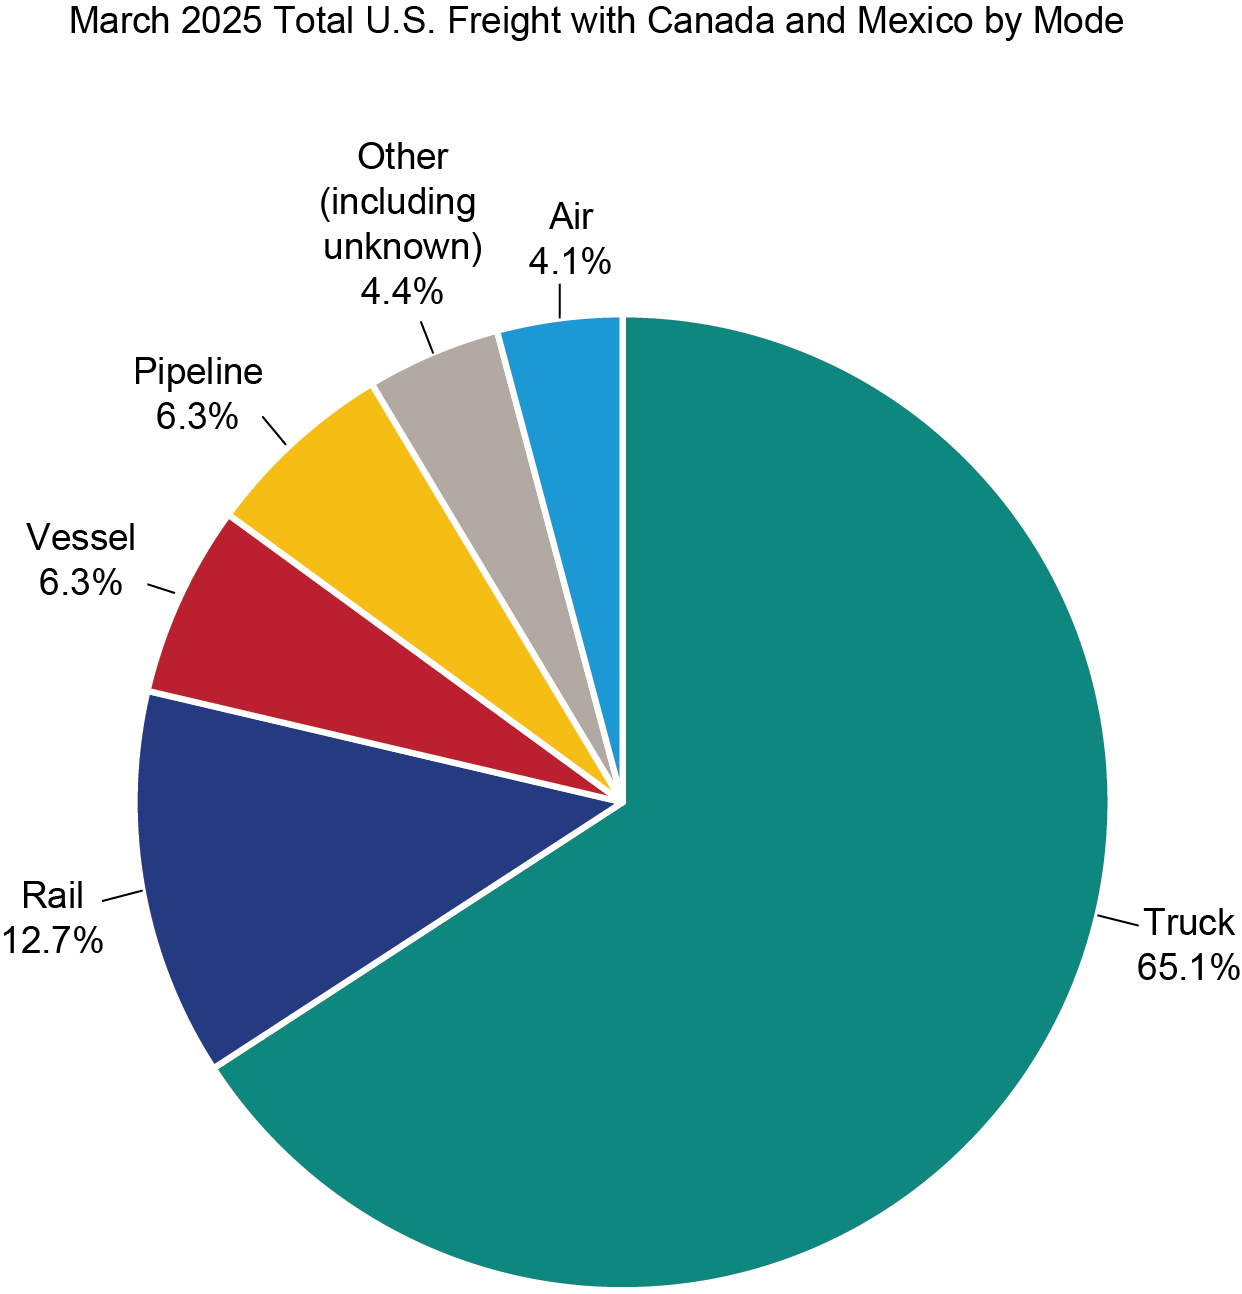
Trucks carry over 60% of the surface trade along the Northern and Southern land borders. Among the major modes of transportation like rail, air, and vessel, trucking is the most efficient and cost-effective way to ship merchandise. For cross-border shipments, trucking offers faster transit times compared to rail, which involves longer routes and multiple handling points.
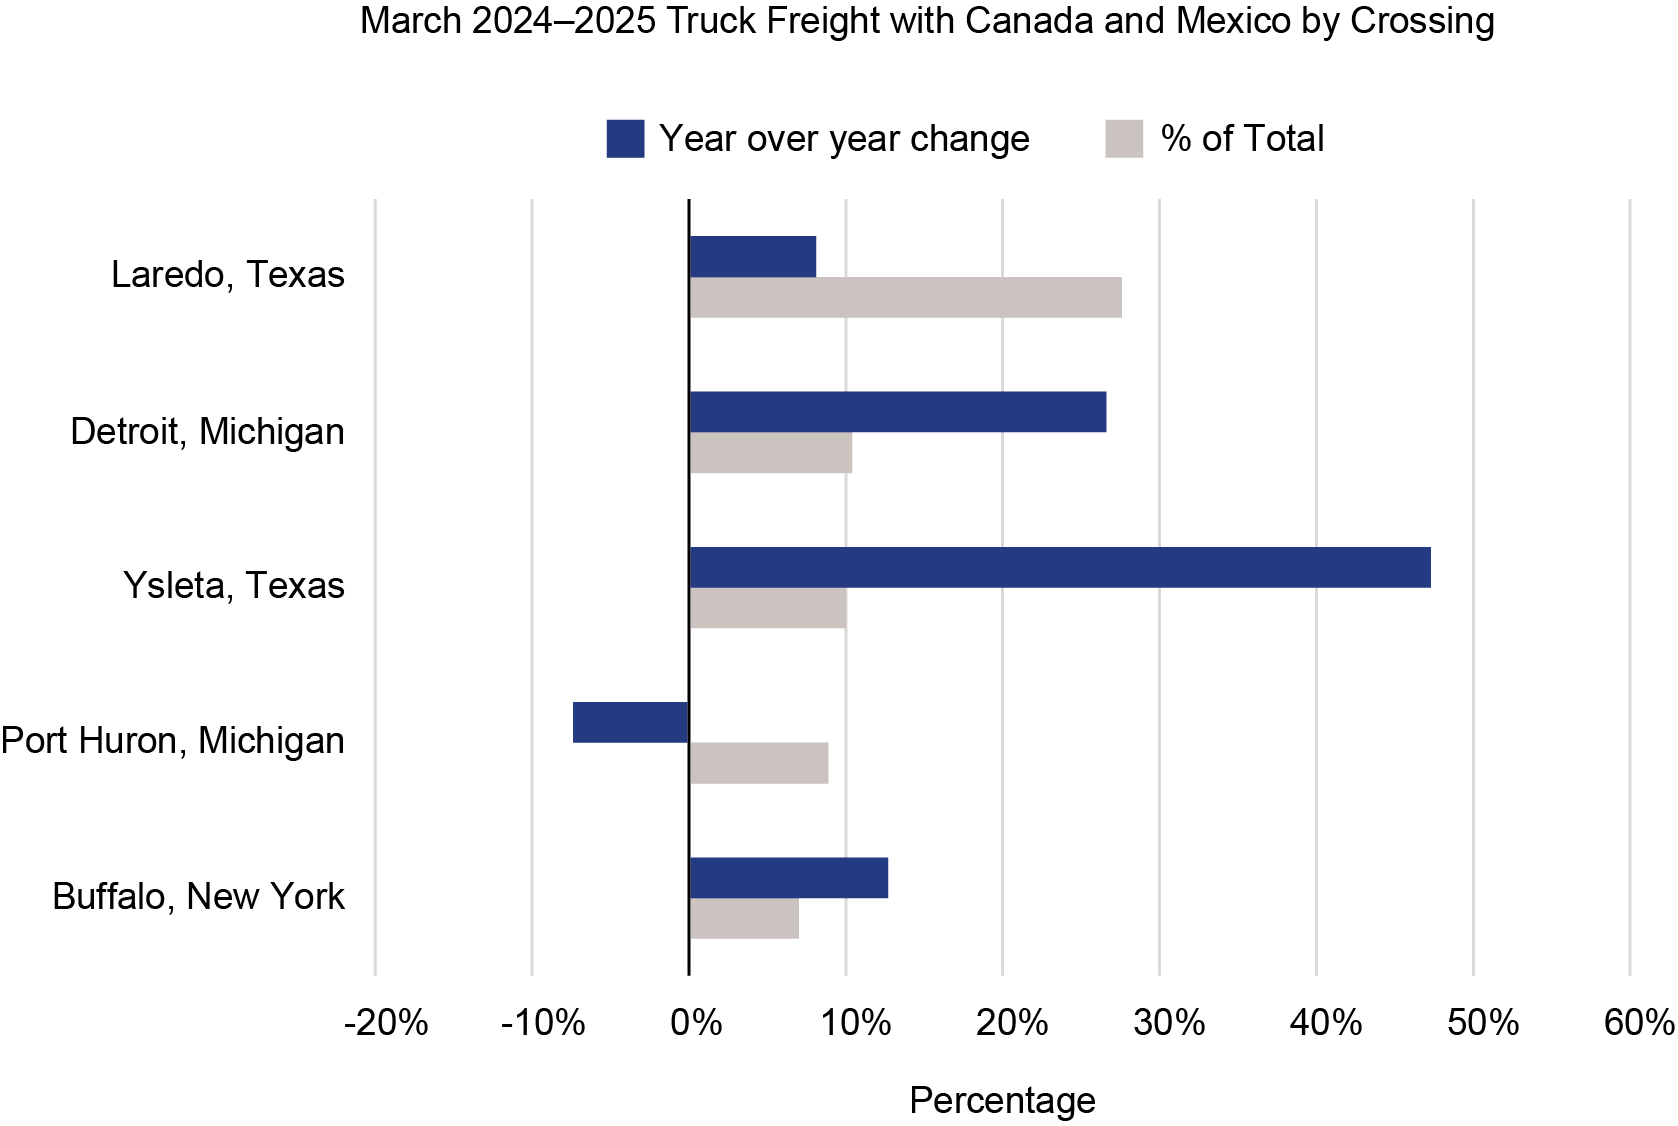
Among the top geographic gateways for movement of freight, land ports of entry such as Laredo and Detroit handle a significant portion of the total shipments with Mexico and Canada. In March 2025, Laredo handled $30.5 billion in 1 month, 12.4 % growth over March 2024. Laredo's location provides the most direct route between major industrial and population areas on both sides. It's close to manufacturing hubs like Monterrey and Guadalajara. Laredo also maintains a robust transportation infrastructure, including highways, bridges (i.e. world trade and Colombia solidarity), rail yards, and pre customs preclearance processing facilities.
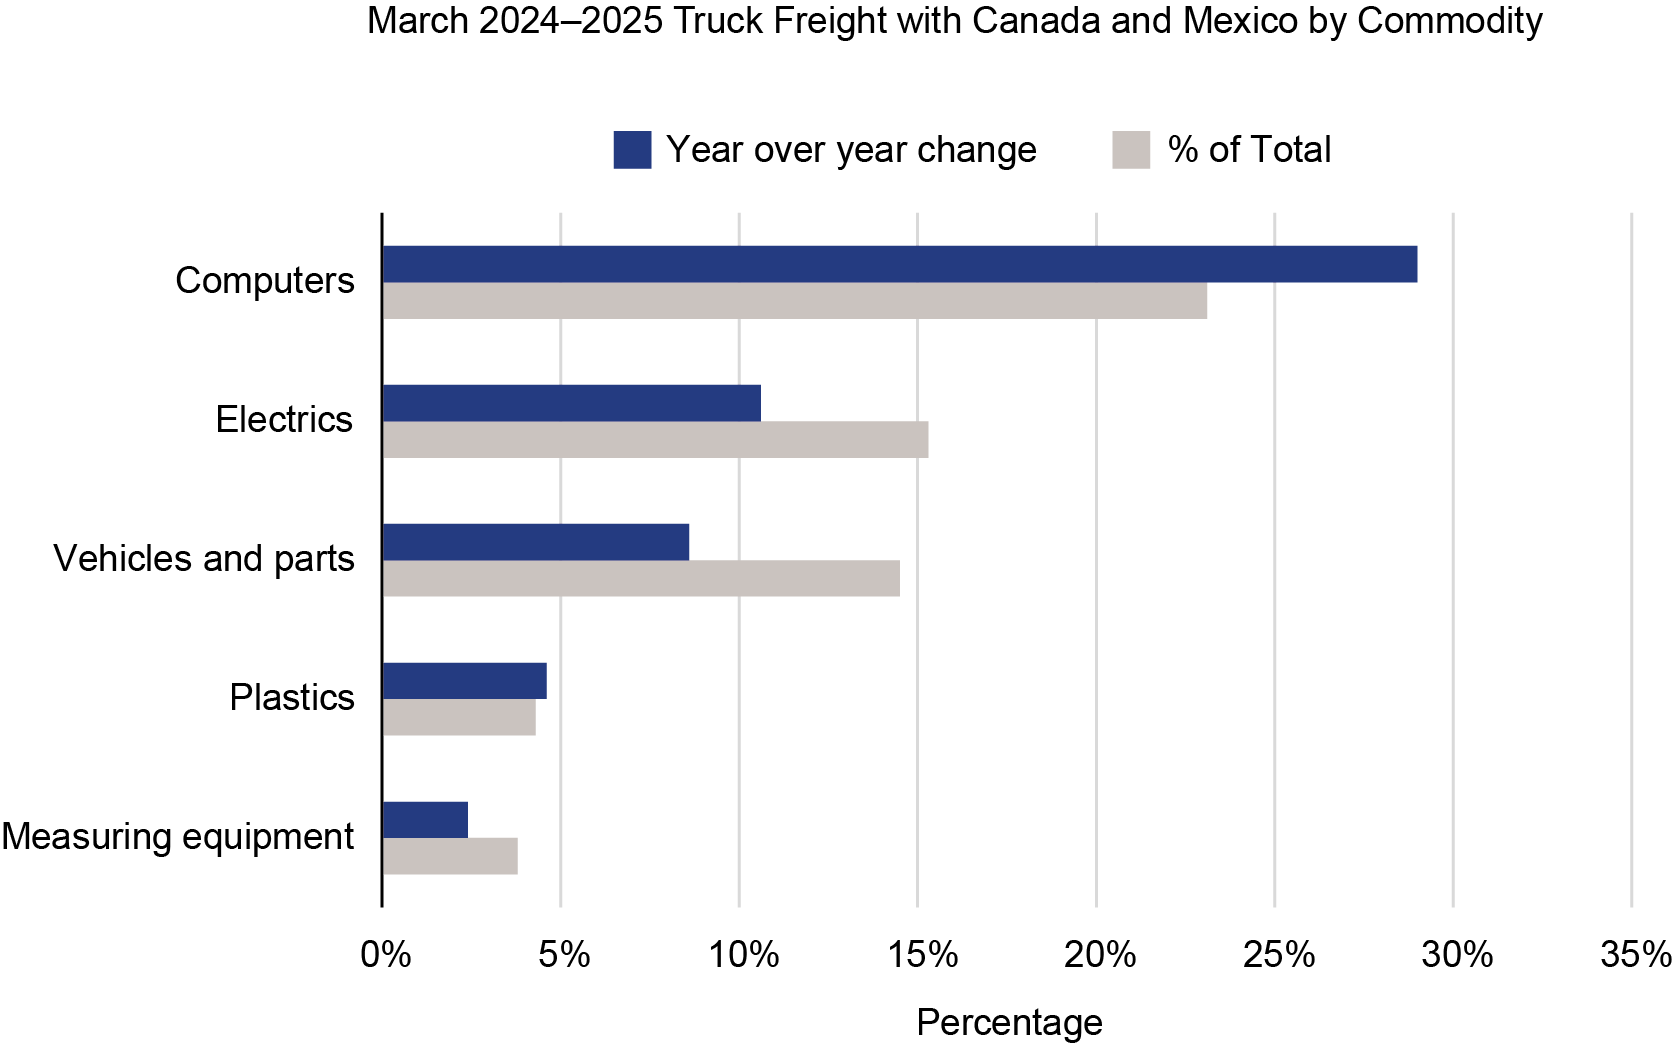
Computers, electronics such as semiconductors, and mechanical auto parts are the largest commodities in merchandise trade with Canada and Mexico. The transmission is designed in Japan, cast in China, shipped to Mexico for assembly, and then sent to a U.S. dealership service department for repair or replacement.
Source: Bureau of Transportation Statistics, Transborder Freight Data, https://data.bts.gov/stories/s/kijm-95mr
The Bureau of Transportation Statistics TransBorder Freight program provides North American freight data by mode of transportation, commodity type, and geographic detail for U.S. exports to and imports from Canada and Mexico. The data are used for trade corridor studies, transportation infrastructure and border planning, marketing and logistics analyses, and other transportation research. BTS publishes a monthly statistical release that highlights key trends in this data, and are often cited by popular trade publications and media outlets. The interactive data dashboards below allow users to visualize data by mode of transportation, commodity, and port of entry or exit. Users can download the raw data here. Documentation associated with the raw data are available here.
To receive updates from BTS directly to your email, please consider subscribing to our GovDelivery service.