
Modal Profiles: U.S. Freight Transportation with Canada, Mexico, and China
Data spotlights represent data and statistics from a specific period of time, and do not reflect ongoing data collection. As individual spotlights are static stories, they are not subject to the Bureau of Transportation Statistics (BTS) web standards and may not be updated after their publication date. Please contact BTS to request updated information.
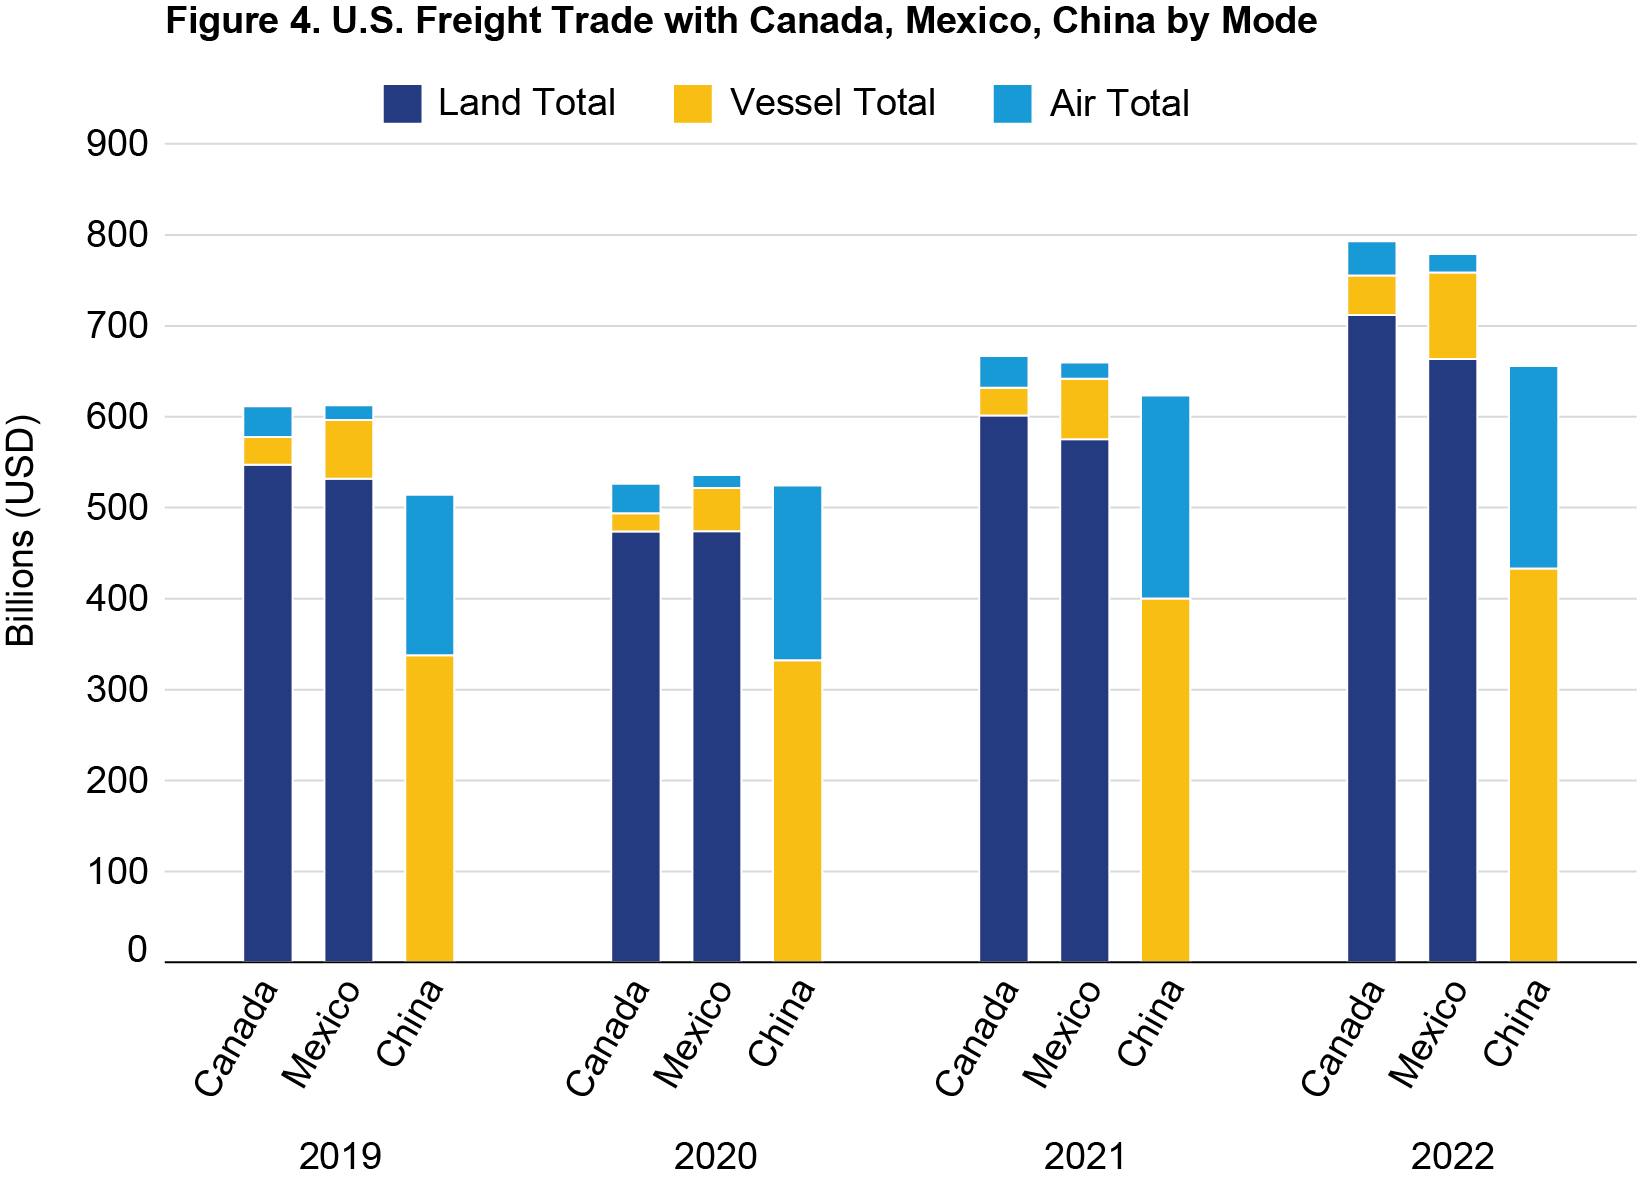
The United States economy relies on a unique mix of transportation modes that enable freight flows with each of its 3 biggest trading partners. Land transportation plays a larger role in moving international trade with Canada and Mexico while aviation and water play a larger role in linkages with China.
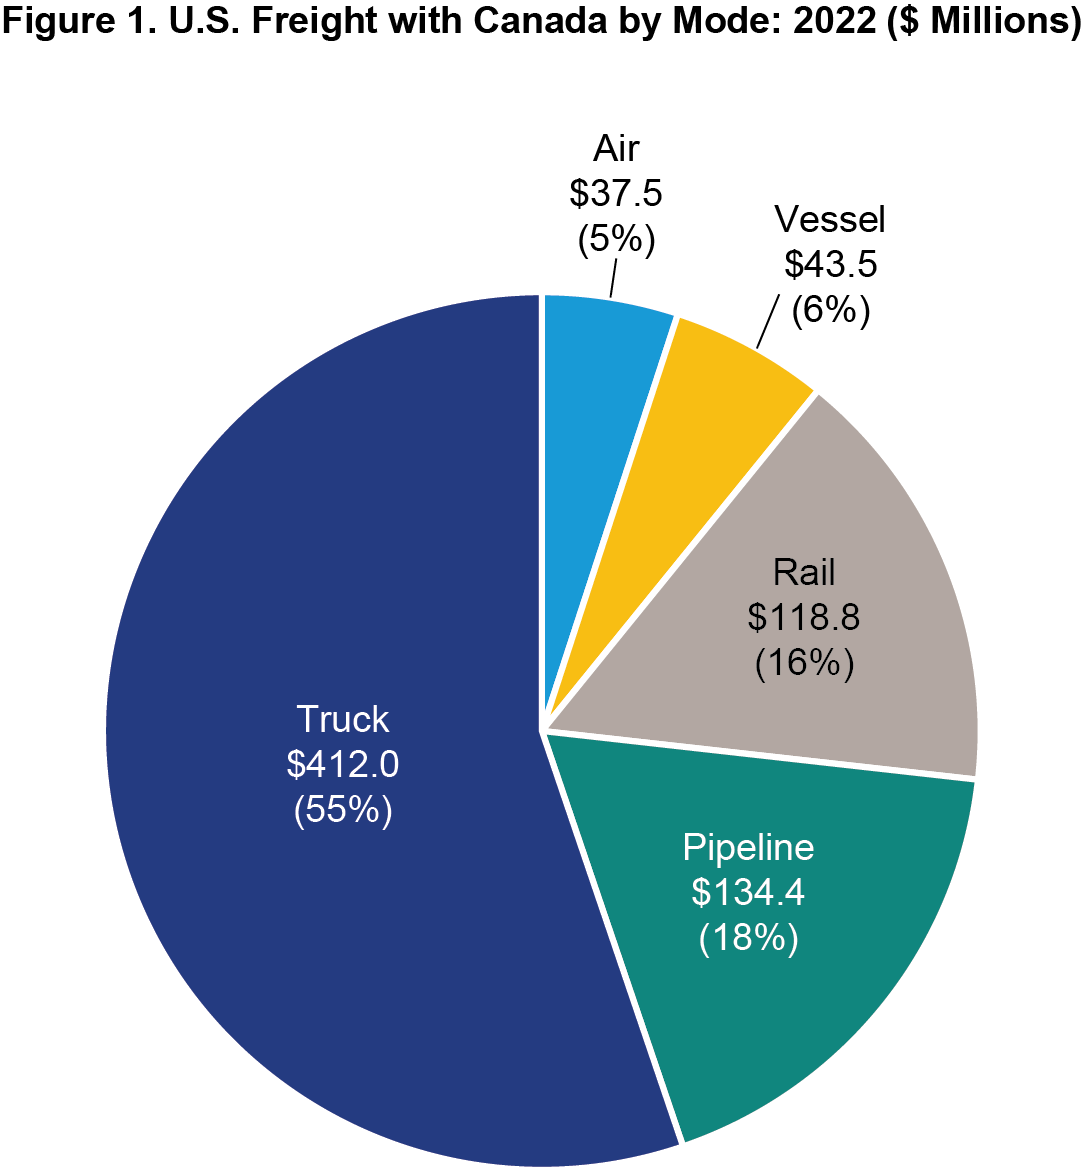
Trucks carried 55 percent of freight between Canada and the United States in 2022, while pipelines accounted for 18 percent and rail 16 percent. Vessel and air modes accounted for 6 and 5 percent, respectively.
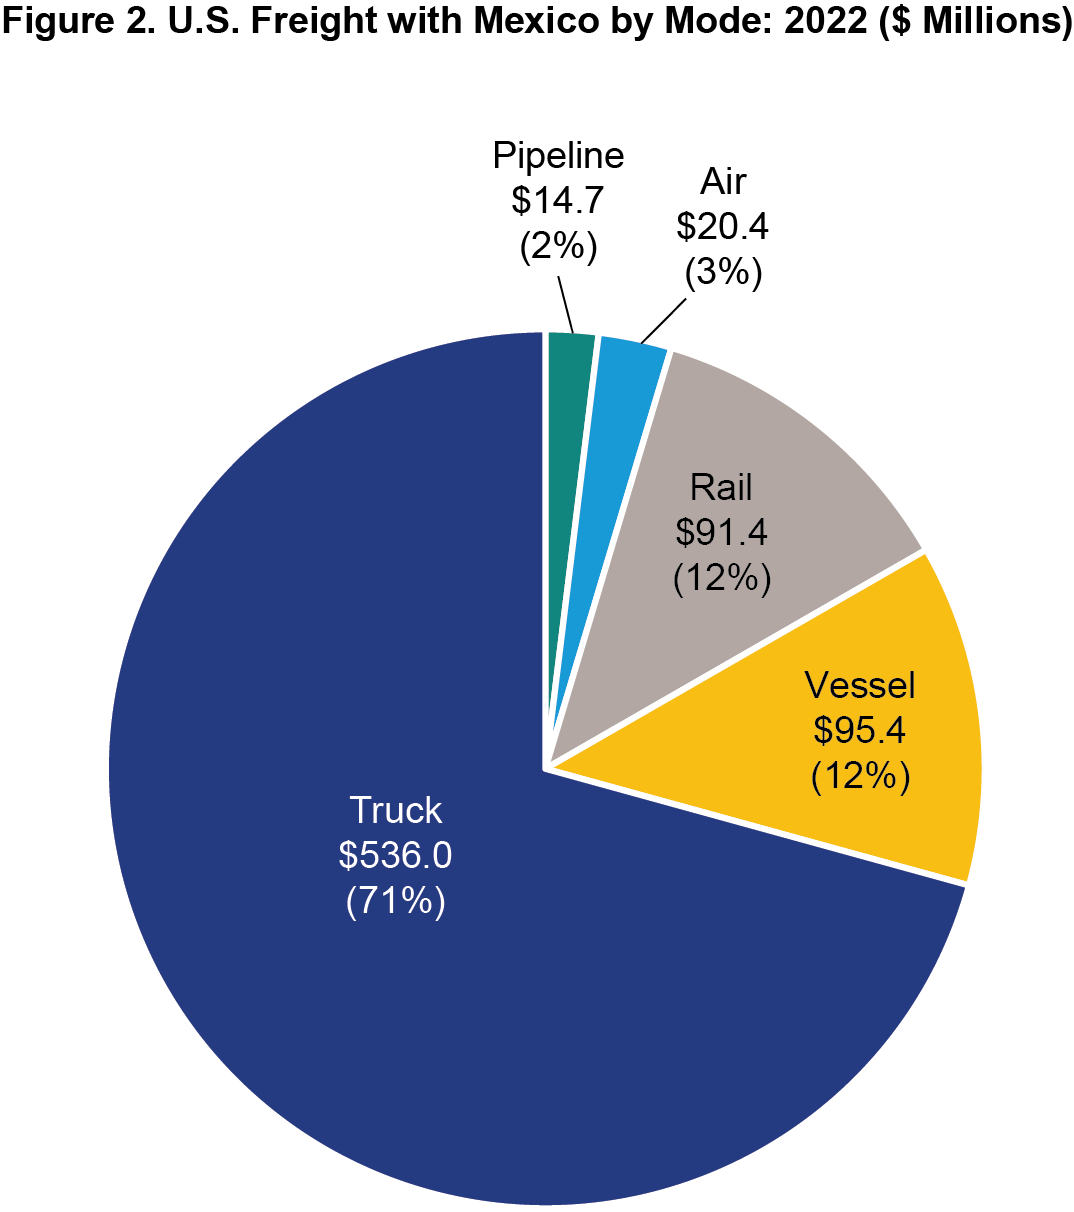
Trucks carried an even larger share of freight between Mexico and the United States in 2022, accounting for 71 percent of total trade while rail and vessel carried 12 percent each, air 3 percent, and pipelines 2 percent.
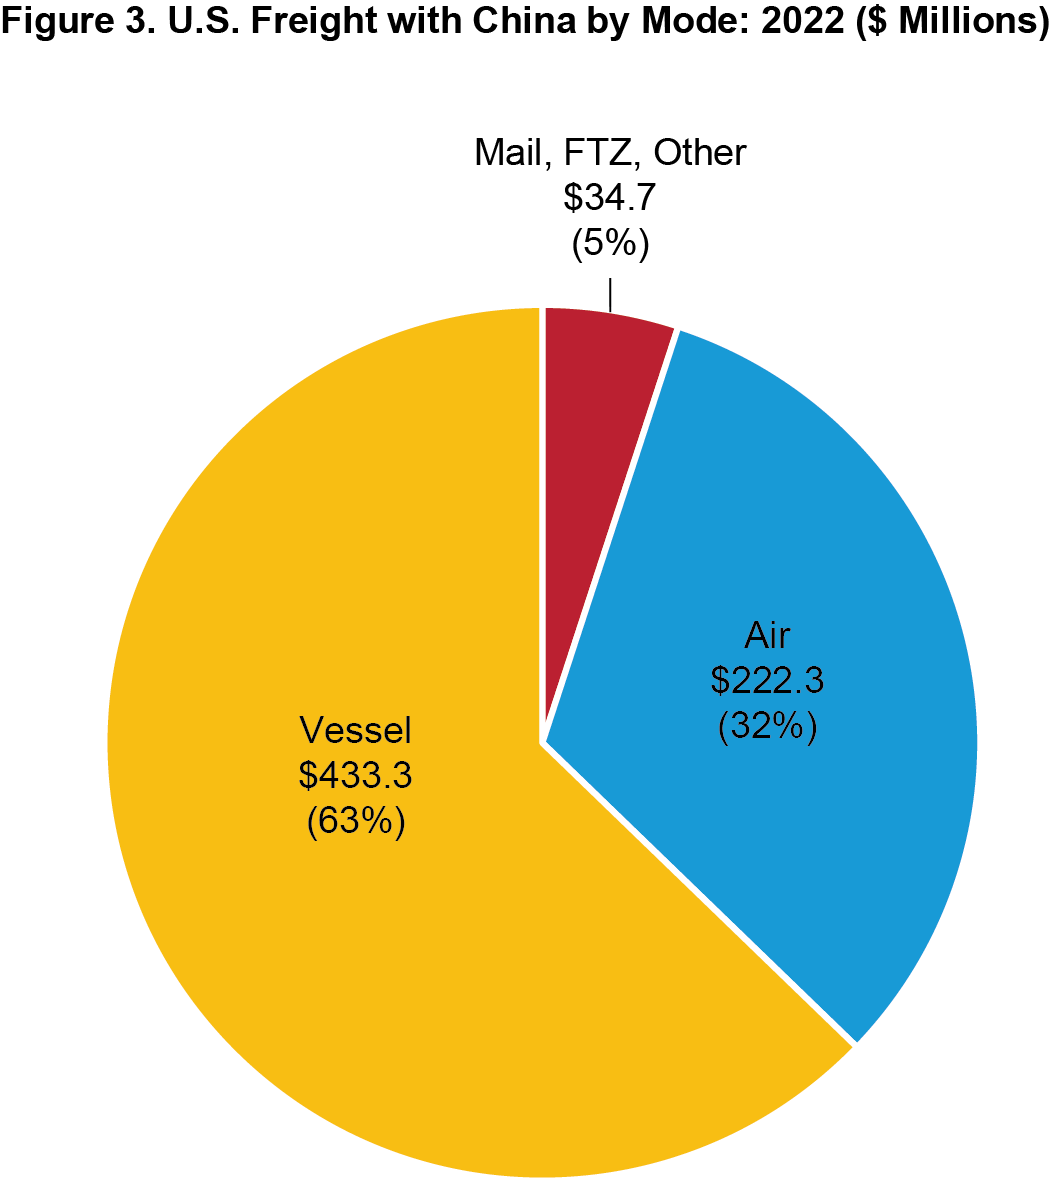
In 2022, U.S. freight trade with China by vessel and air modes of transportation account for 63 and 32 percent, respectively. The remaining 5 percent involves foreign trade zones, mail, and other freight moves that are not identified with a specific mode of transportation.
Key Freight Value Data
- In 2022, U.S. total freight trade with China by air and vessel modes outpaced that of Canada and Mexico, a trend that has continued since before the pandemic.
- Air freight from China decreased from $223.1 billion in 2021 to $222.3 billion in 2022.
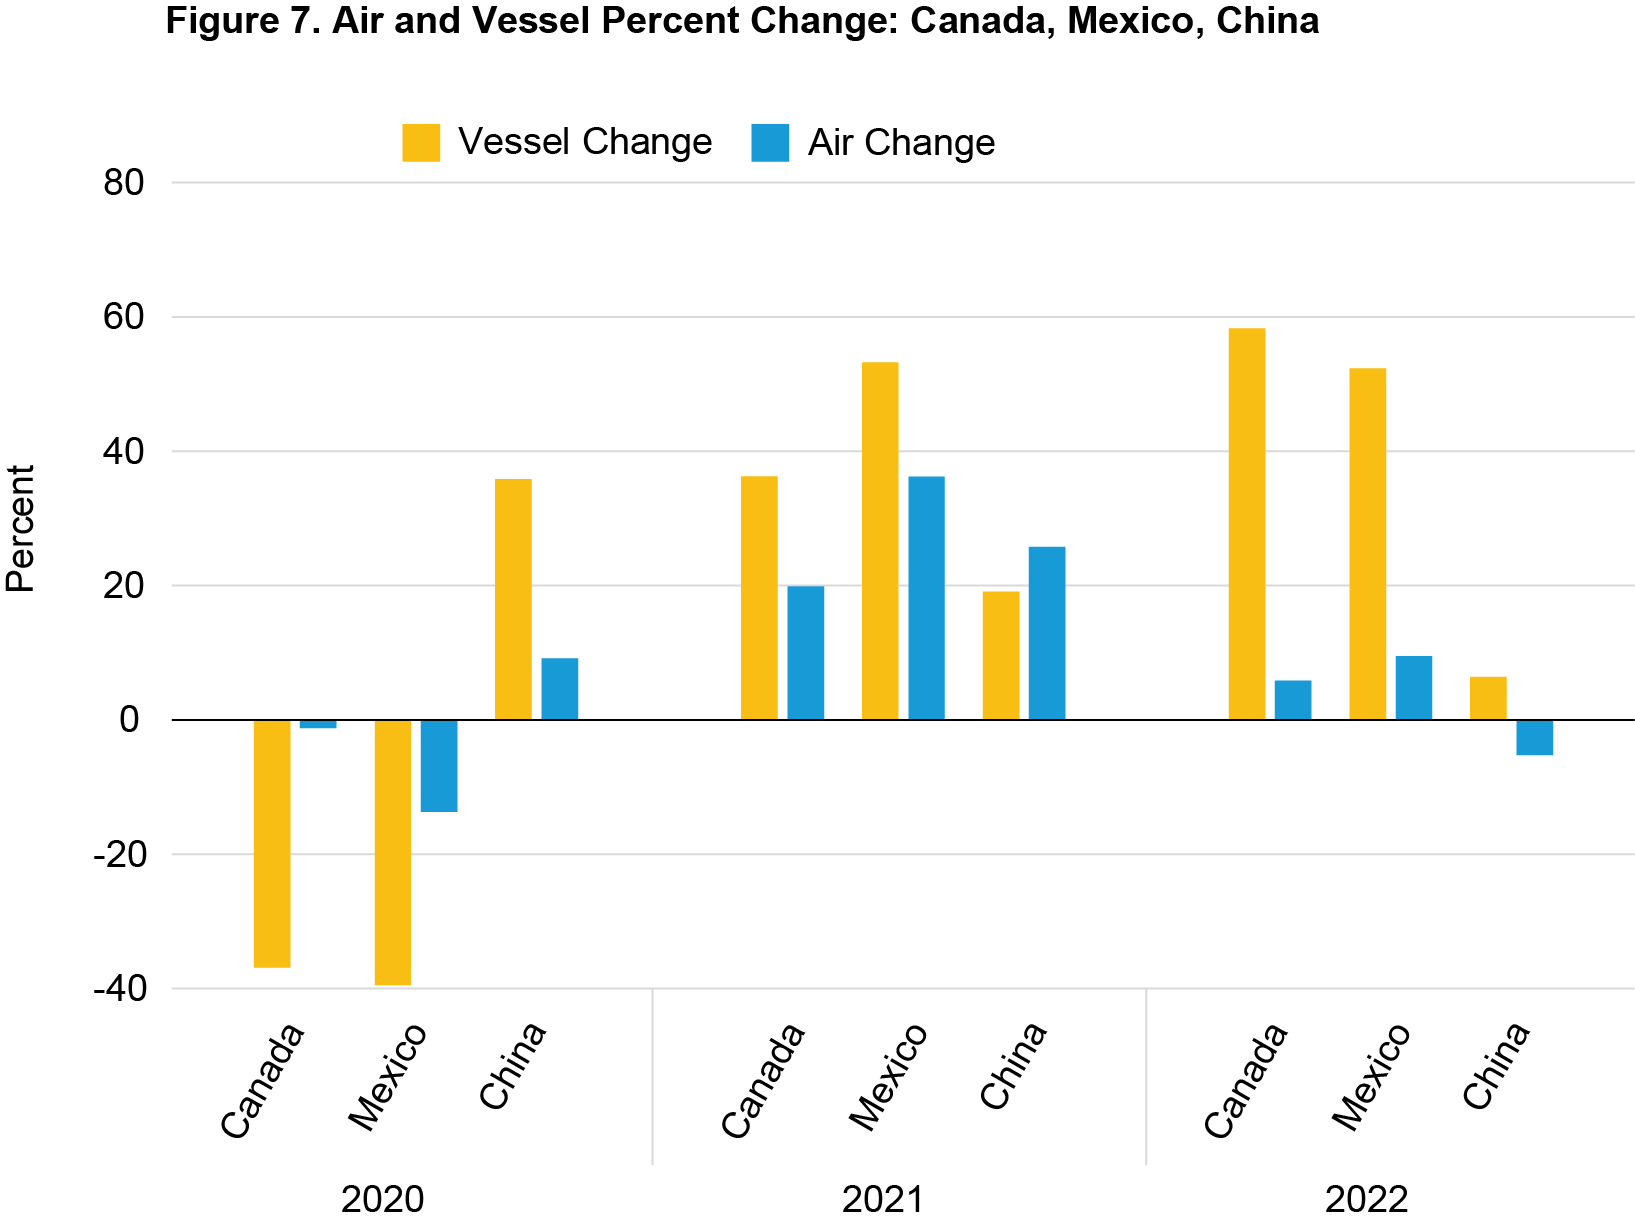
- The value of freight flows by vessel with Mexico increased from $66.7 billion in 2021 to $94.9 billion. The value of oil and fuels increased coming out of the pandemic while the volumes remained steady.
U.S.-Canada Data Points
- Detroit, Port Huron, and Buffalo are the top truck ports for U.S. freight flows with Canada.
- Detroit, Port Huron, and International Falls are the top rail connection ports for U.S. freight flows with Canada.
- Chicago, Port Huron, and Minneapolis are the top pipeline connection regions for U.S. energy freight flows with Canada.
- Port of Boston, Arthur, and Portland are the top water port connections for U.S. energy flows with Canada.
U.S.-Mexico Data Points
- Laredo, El Paso, and Otay Mesa are the top truck ports with Mexico.
- Laredo, Eagle Pass, and El Paso are the top rail connection ports with Mexico.
- El Paso, Hidalgo, and Laredo are the top pipeline connection regions with Mexico.
- Port of Houston, Arthur, and Texas City are the top water port connections for U.S. energy flows on the Southern border.
- Energy flows by vessel with Mexico are more expansive than pipeline flows with Canada.
In 2022, China air and vessel freight imports (valued at $505.7 billion) continued to outpace imports from Canada ($436.6 billion) and Mexico ($454.8 billion) in electrical machinery, toys, and furniture. Vessel imports from Mexico continue to outpace Canada in oil and automobile commodities. The total value of imports from Mexico continued to be higher than Canada in electrical machinery, autos, and oil.
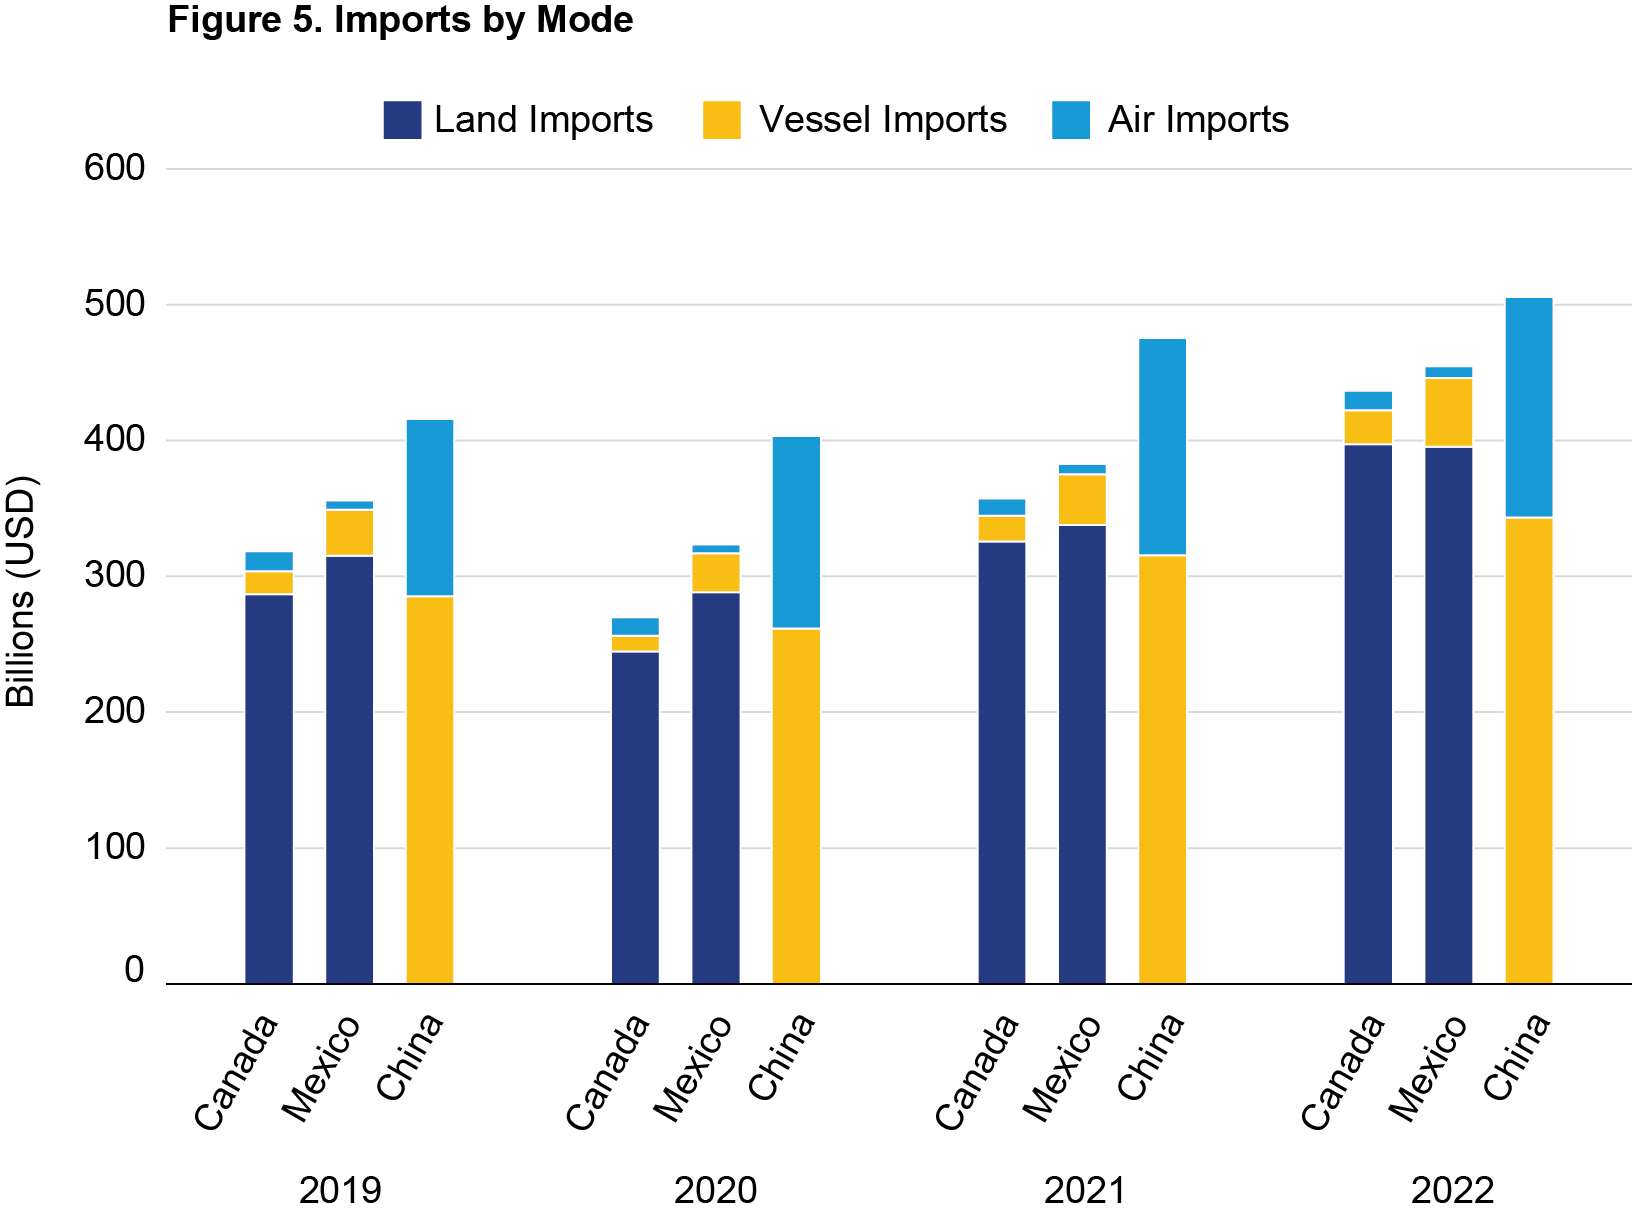
The data indicate a slowdown in the value of U.S. freight imports from Canada and China in 2023. August 2023 data shows imports from China decreased 27.1 percent year-over-year, while Canada decreased 6.9 percent and Mexico increased 3.8 percent.
Table 1 Value of U.S. Imports from China and Canada, January–August 2023

Meanwhile, in 2023, oil, electronics, and auto exports to Mexico narrowed the export gap with Canada at the fastest rate since 2019. Similarly for exports, the data indicate a slowdown in the value of U.S. exports to China in 2023.
During the pandemic in 2020, exports by air and vessel to China continued to increase over 2019 totals, while exports to Canada and Mexico decreased. In 2021 and 2022, vessel exports to China continued to increase in oil, grains, and autos. However, air exports to China decreased from $63.4 in 2021 to $60.0 billion in 2022 in electrical machinery, aircraft parts, and pharmaceuticals.
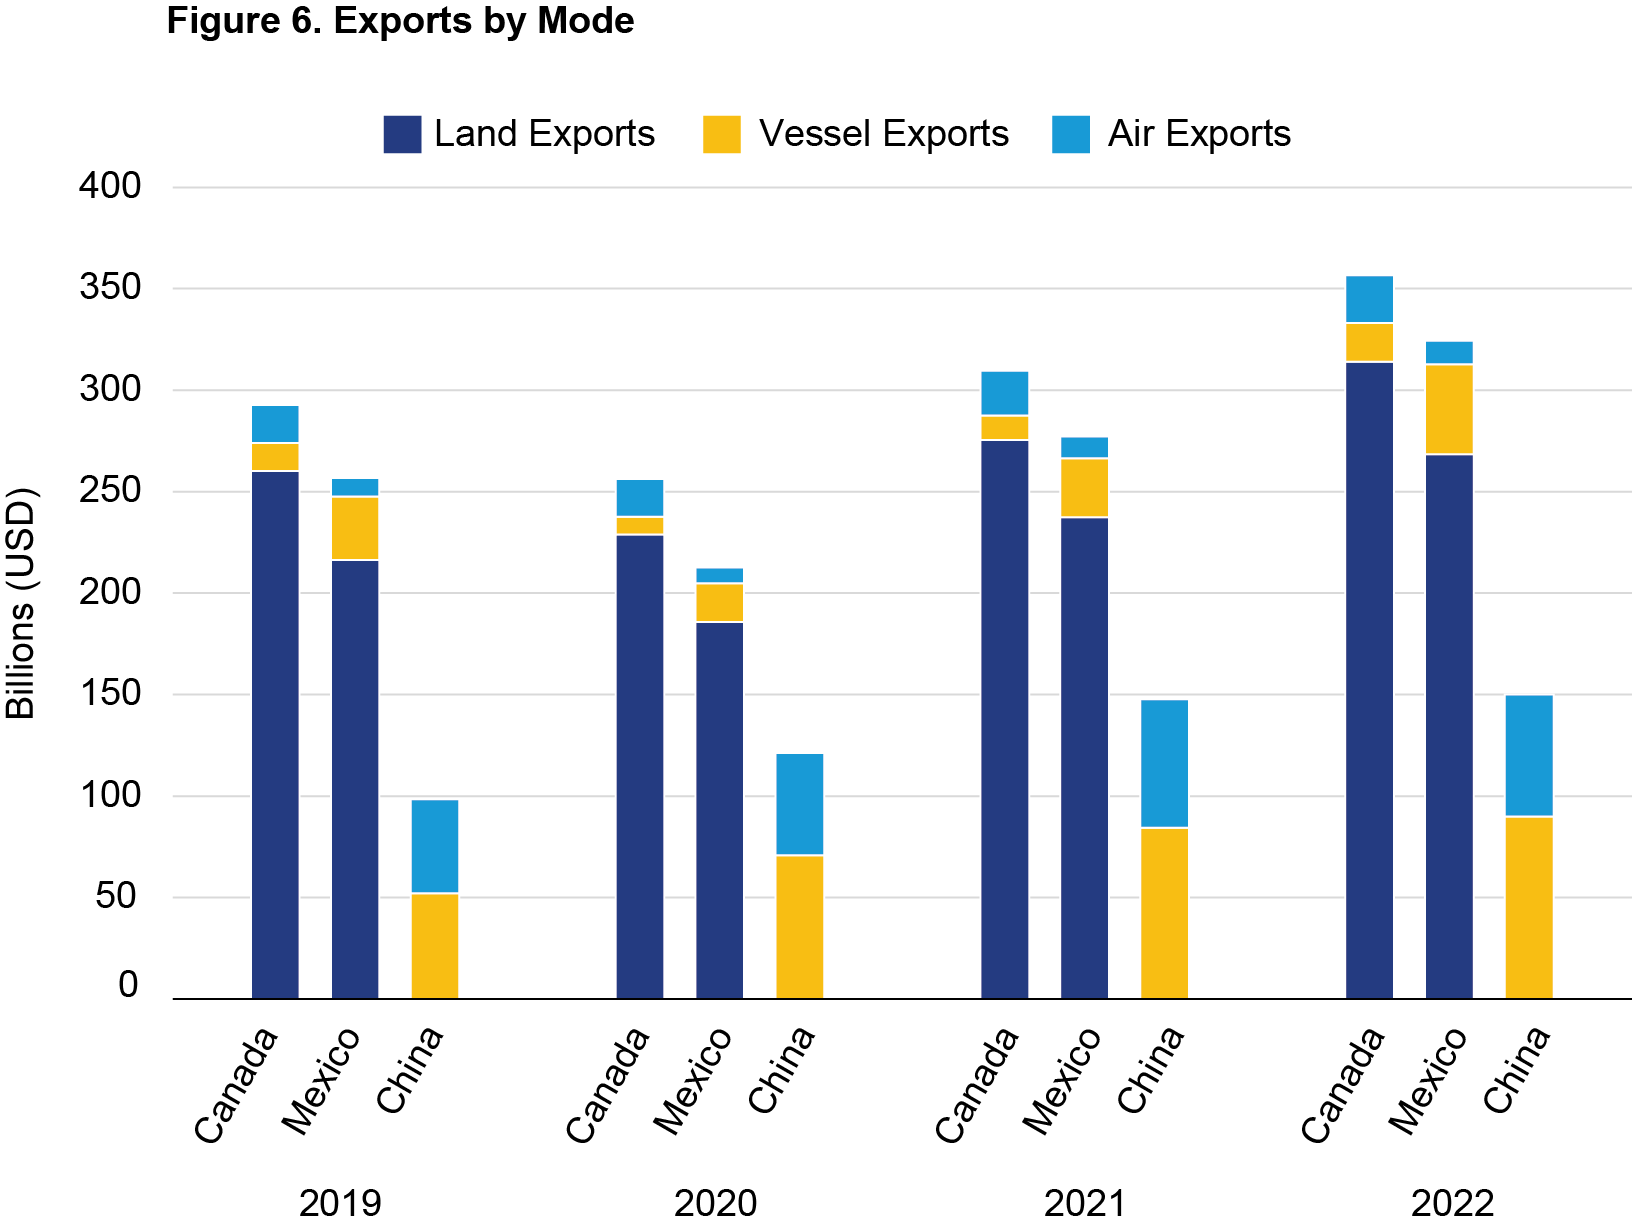
During the pandemic in 2020, total freight exports by vessel and air modes with China were not as severely impacted as they were with Canada and Mexico. The rebound in the value of energy commodities by vessel with both Canada and Mexico are clearly indicated in the blue vessel bars in 2022. Meanwhile, U.S. freight exports by air to China rebounded less than air exports to Canada and Mexico in 2022.
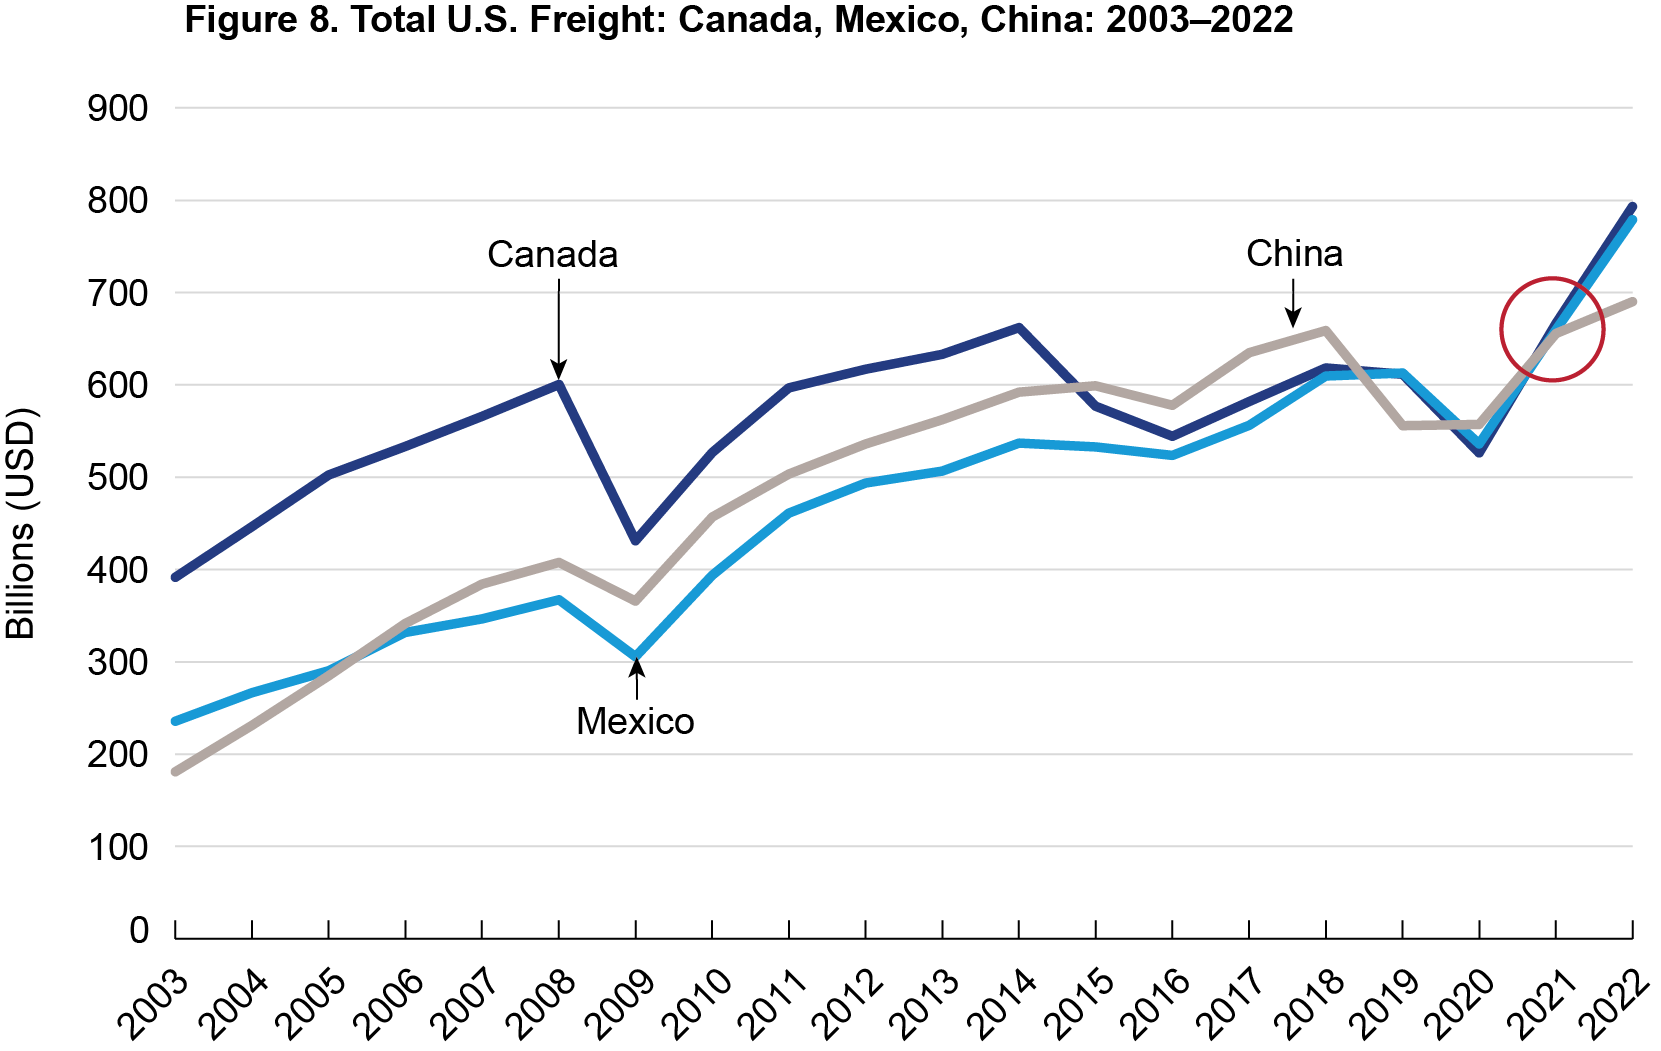
Canada has traditionally been the largest U.S. trade partner, followed by China and Mexico. However, economic changes since the pandemic may have altered this relationship. Since 2020, U.S. freight flows with Canada and Mexico have both outpaced China, with Mexico leading the top spot. According to Bureau of Transportation Statistics TransBorder freight data, Mexico has led Canada and China in monthly freight flows for 7 out of 8 months in 2023. Year to date, Mexico ranks first with $503.7 billion, while Canada comes in second with $486.2 billion, and China third with $359.0 billion. If this trend continues, it will be the second time on record where Mexico ranks first in U.S. freight flows. The other time was in 2019 when Mexico ranked ahead with $612.8 billion, edging out Canada with $611.4 billion and China at $555.6 billion. For the first time since 2019, U.S. freight imports from China have decreased more than Canada and Mexico.
Notes: For Canada and Mexico, data do not include trans-shipments, mail, other, and foreign-trade zones (FTZ).
Sources: Bureau of Transportation Statistics, North American Transborder Freight Data, available at https://www.bts.gov/transborder. U.S. Census Bureau, USA Trade Online, available at https://usatrade.census.gov