Notable for Bike To Work Week: National Spending on Bicycles and Accessories Grew 620% from March 2020 to March 2023; Docked Bikeshare Grew 42% percent
Data spotlights represent data and statistics from a specific period of time, and do not reflect ongoing data collection. As individual spotlights are static stories, they are not subject to the Bureau of Transportation Statistics (BTS) web standards and may not be updated after their publication date. Please contact BTS to request updated information.
With bicycling season upon us, 2023 could be another banner year.
As bicycling season moves into full gear, total U.S. spending on bicycles and imports of bicycles remain at all time-high levels while ridership on docked bikeshare systems continues to grow. As previous BTS spotlights have noted, COVID-19 triggered a significant increase in household spending on bicycles and accessories. From March 2020 (the first month of the COVID-19 national emergency) to March 2023 (the latest available data), bike spending has increased 620%, adjusted for inflation. In the last year, total national household expenditures on bicycles and accessories have remained around $8.0 billion per month (adjusted for inflation) (Figure 1).
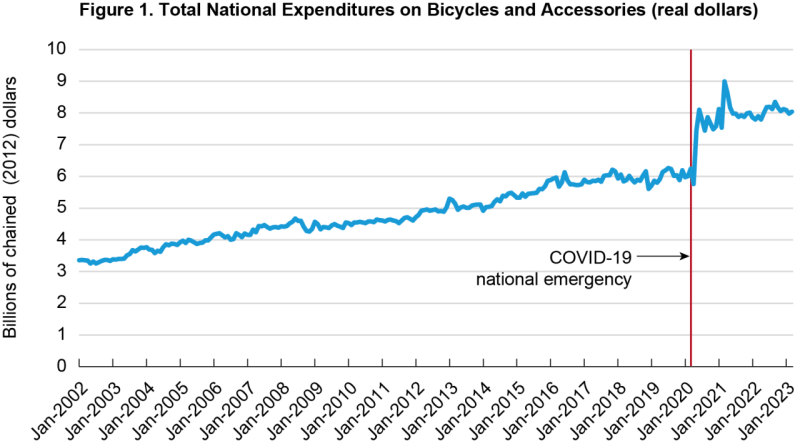
Source: Bureau of Economic Analysis, National Income and Product Accounts, Table 2.4.6U, available at https://www.bea.gov/itable/national-gdp-and-personal-income, as of May 2023
Bike demand leads to increase in imports.
Increased demand for bicycles also has contributed to an increase in imports of bicycles. The total value of non-motorized bicycles imported increased just over 18,000% from 0.5 million in March 2020 to 1.0 billion in February 2023 (adjusted for inflation). Comparing the latest data month in 2023 (February) to the same month in 2020, to reduce seasonal effects in trade levels, still yields just over 1000% increase (from 8.2 million in February 2020 to 1.0 billion in February 2023) in the value of non-motorized, bicycles imported. Data on motorized bicycles imported are not available.
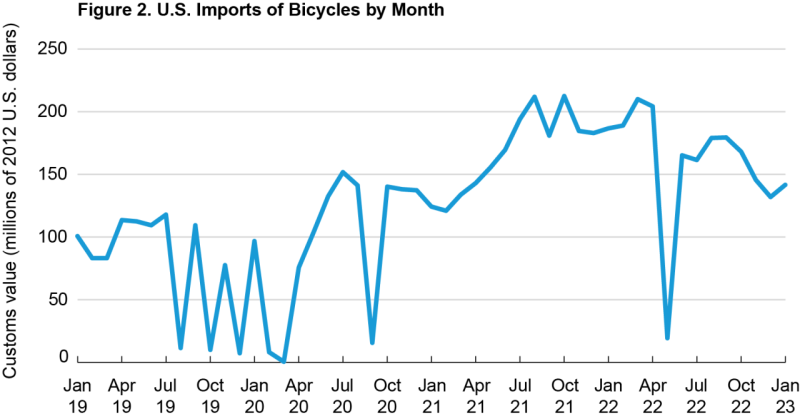
Source: U.S. Department of Transportation, Bureau of Transportation Statistics calculations from U.S. Census Bureau, USA Trade Online, harmonized system import data for bicycles and other cycles (8712), available at https://www.census.gov/foreign-trade/data/index.html, as of May 2023 and U.S. Bureau of Labor Statistics, Import and Export Price Indexes, series id EIUIP87, available at https://www.bls.gov/mxp/ as of May 2023.
Bikeshare ridership on largest networks saw COVID boost.
There are no national level data on the total number of trips made by bicycle. However, data on the number of trips made on the largest docked bikeshare systems and the use of a bicycle as a means of transportation to work paint a partial picture of bicycle use.
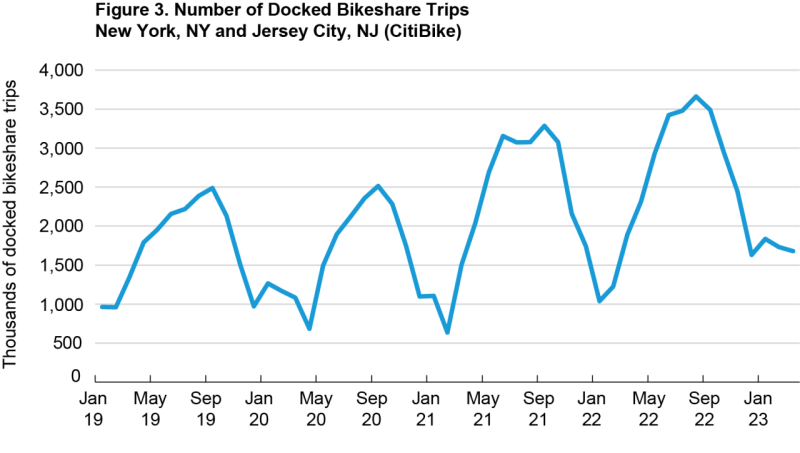
Total docked bikeshare ridership on six of the largest systems increased 42% from March 2020 to March 2023. Not all six of the largest systems experienced equal growth. The number of trips taken on CitiBike, which serves multiple boroughs in New York City and several cities in New Jersey, increased 55% from March 2020 to March 2023, while over the same time period, trips taken on Divvy (Chicago, IL) increased by only 9% (Figure 3 and 4). Differences in the severity of winter weather from year-to-year and across systems partly contribute to the differences across systems.
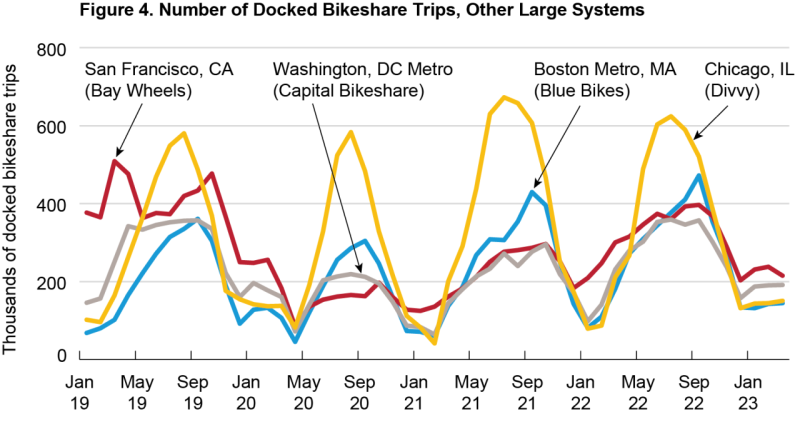
Note: “Large” defined as having more than 400 docking stations as of July 2022.
Source: U.S. Department of Transportation, Bureau of Transportation Statistics, Docked Bikeshare Ridership by System, Year, Month, and Day, available at https://data.bts.gov/Research-and-Statistics/Docked-Bikeshare-Ridership-by-System-Year-Month-an/g3h6-334u as of May 2023
While docked bikeshare trips have increased, bicycling as a principal means of transportation to work fell slightly (0.1 percentage points) from 2019 to 2021 (the latest available data) (Figure 5). “Principal means” refers to the mode of travel used to get from home to work most frequently and for the longest distance if combined with another mode. The observed decline is the result of both a 24% decline in the number of workers bicycling from home to work and a significant increase in the share of persons working from home (from 6% in 2019 to 18% in 2021) (Figure 5 and 6). It also may be from persons switching from bicycles to micromobility devices such as scooters.
The number of cities served by an e-scooter system increased from 87 in 2019 to 136 in 2021 and then to 158 in 2022. In contrast, the number of cities served by a dockless bikeshare system declined from 53 to 34 from 2019 to 2021 before increasing to 35 in 2022. The number of docked bikeshare systems, which with few exceptions serve a single city, declined from 102 to 62 from 2019 to 2021 and then to 61 in 2022 (Figure 7).
For more docked and dockless bikeshare and e-scooter statistics, see the Bureau of Transportation Statistics’ bikeshare and e-scooter data.
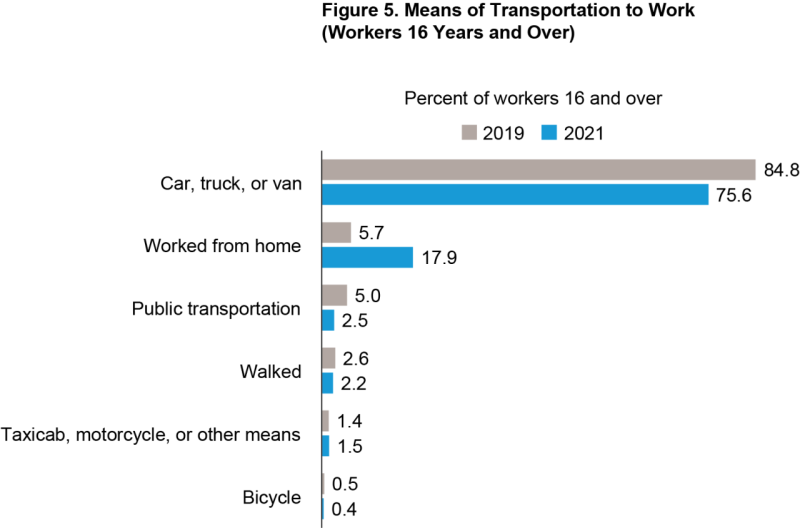
Source: U.S. Census Bureau, American Community Survey, 1-year estimates, table B08301, available at https://data.census.gov/ as of May 2023.
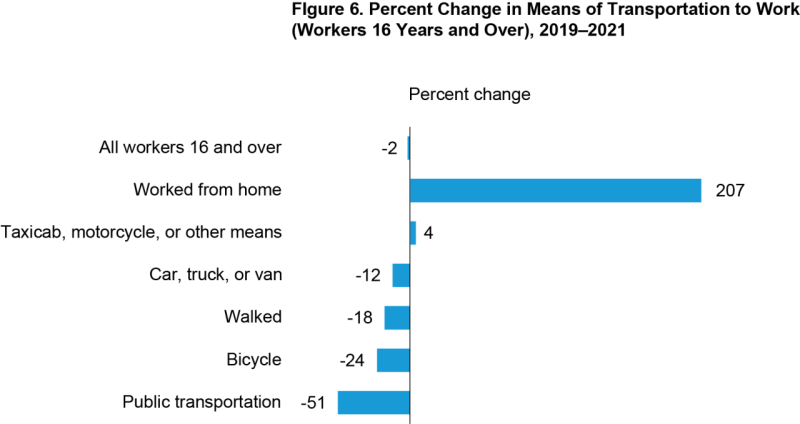
Source: U.S. Census Bureau, American Community Survey, 1-year estimates, table B08301, available at https://data.census.gov, as of May 2023.
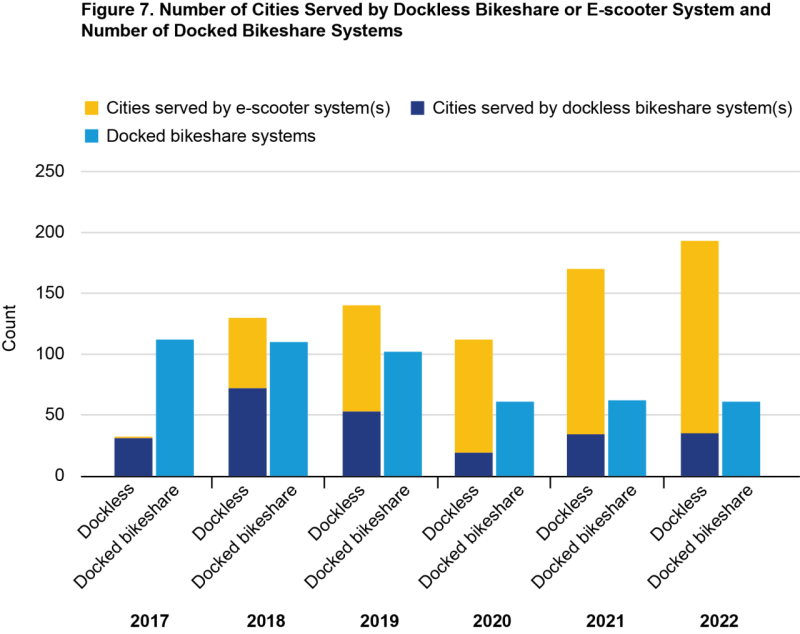
Source: U.S. Department of Transportation, Bureau of Transportation Statistics, Bikeshare and E-scooter Systems in the U.S., available at https://data.bts.gov/stories/s/Bikeshare-and-e-scooters-in-the-U-S-/fwcs-jprj/
