
Number of Alternative Fueling Stations Nearly Doubles Since 2020; EV Charging Leads the Way
Data spotlights represent data and statistics from a specific period of time, and do not reflect ongoing data collection. As individual spotlights are static stories, they are not subject to the Bureau of Transportation Statistics (BTS) web standards and may not be updated after their publication date. Please contact BTS to request updated information.
BTS NTAD data updated daily with new station locations.
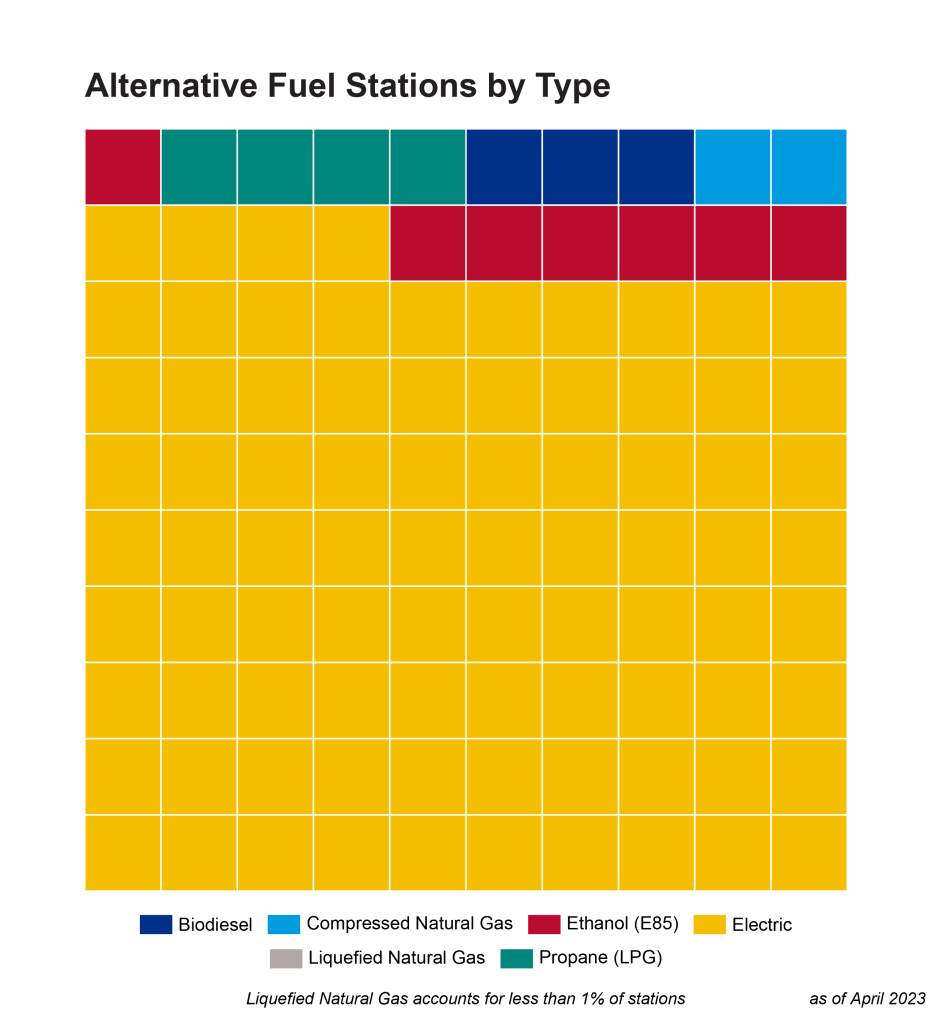
Alternative energy sources have been at the forefront of strategies to reduce carbon emissions. This is especially true in transportation, the sector responsible for the most greenhouse gas emissions in the U.S. The latest data in the BTS National Transportation Atlas Database shows that recent growth in alternative fueling stations for vehicles has been impressive. As of April 1, the U.S. boasted more than 70,000 alternative fueling stations up nearly 90 percent since April 1, 2020, when we had fewer than 40,000 such stations around the country. Alternative transportation fuels include a variety of products, including ethanol, biodiesel, propane, hydrogen, natural gas, and electricity.
EV charging stations dominate the alternative fueling station landscape.
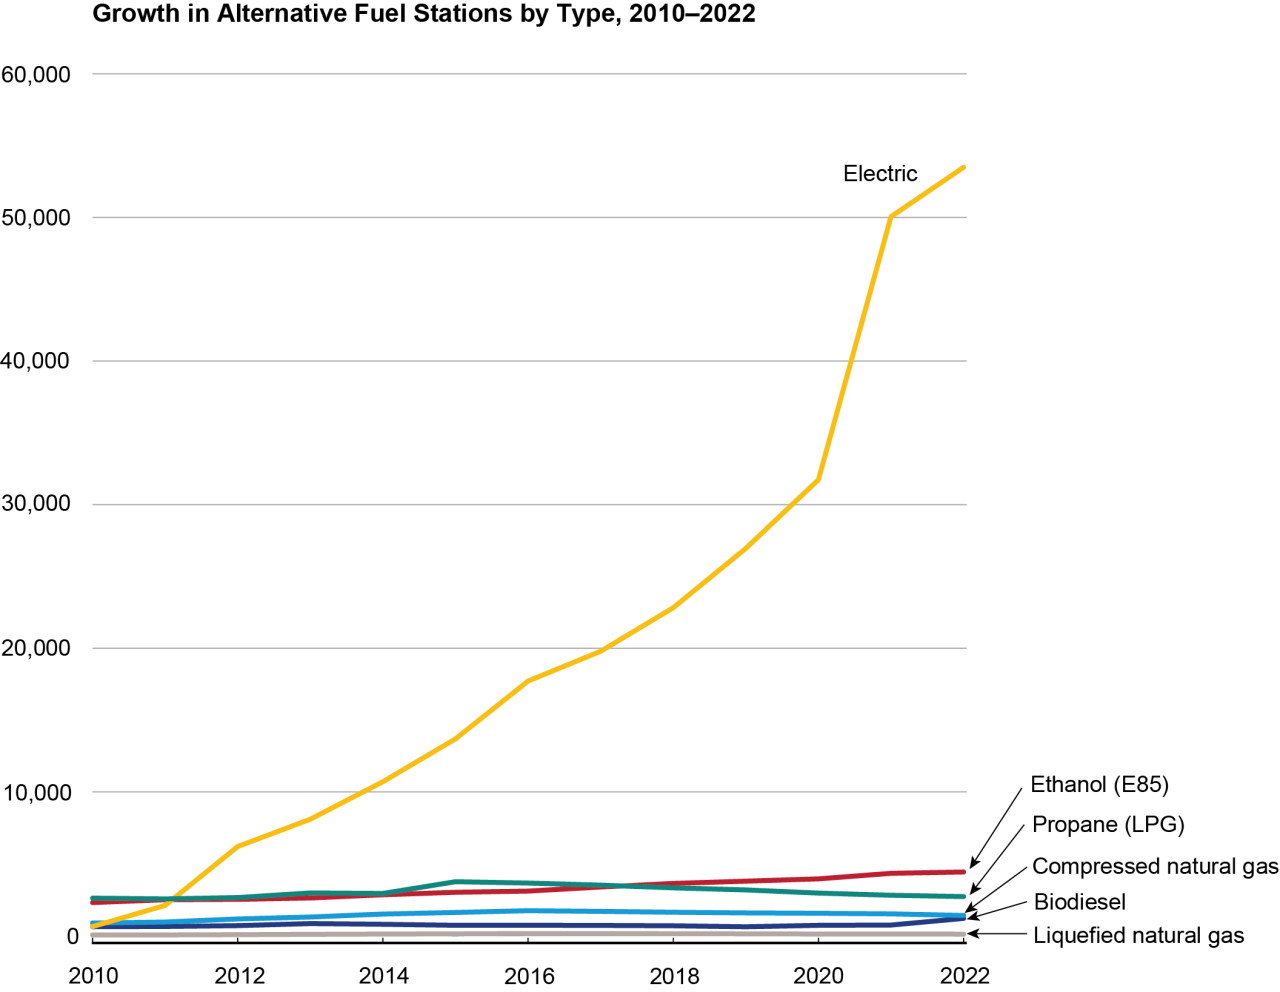
Electric vehicle (EV) charging stations have been growing faster than any other fueling categories and now account for about 84 percent of all alternative fueling stations.
By the end of 2011, the U.S. had about 2,100 EV charging stations. Their growth accelerated dramatically around 2012 on the heels of the American Recovery and Reinvestment Act of 2009, which included up to $2 billion in federal funding advanced battery manufacturing and up to $400 million for transportation electrification projects. Over the course of 2012, the number of EV charging stations tripled, with an additional 4,100 stations opening that year alone. Between 2013 and 2020, that trend continued with a nearly 300 percent increase in the total number of EV charging stations, for a total of about 32,000 stations. Between January 1, 2021, and April 1, 2023, another 19,000 stations opened, increasing the number of electric vehicle charging stations by nearly 50 percent in just over two years.1
California is home to the highest number of EV charging stations in the country.
Electric vehicle charging stations are not evenly distributed across the U.S. Of the more than 60,000 EV charging stations, California is home to approximately 16,000 or about 21 percent. New York, Florida, Texas, and Massachusetts close out the top five states with the greatest number of EV stations, with upward of 2,500 stations each.
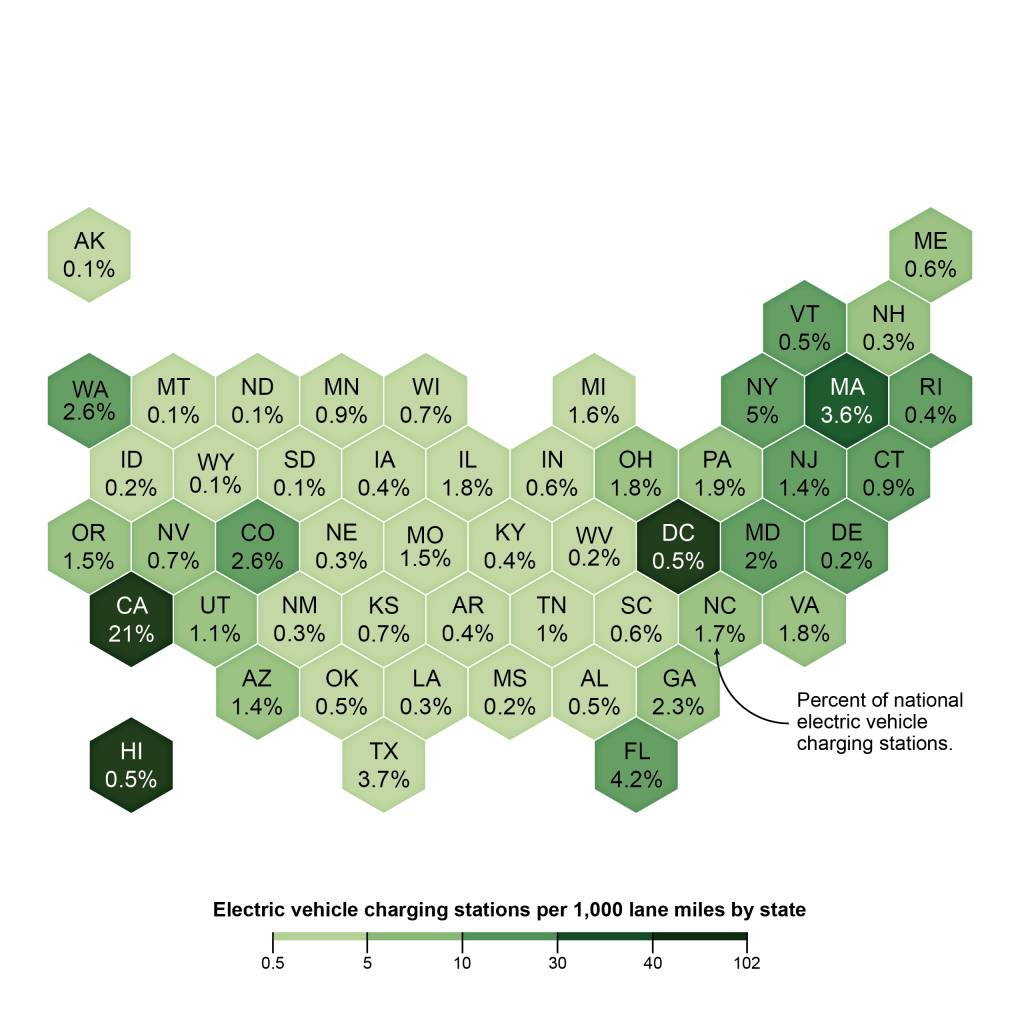
Looking at the normalized data per 1,000 road lane miles2, Washington, D.C., had the highest number of stations, at 102 per 1,000 lane miles, followed by Hawaii then California. Arkansas was the leader in terms of its rate of charging station growth in the last year (2022 to 2023), followed by North Dakota, Michigan, Louisiana, and New Jersey. All five states increased the number of their electric vehicle charging stations by more than 25 percent.
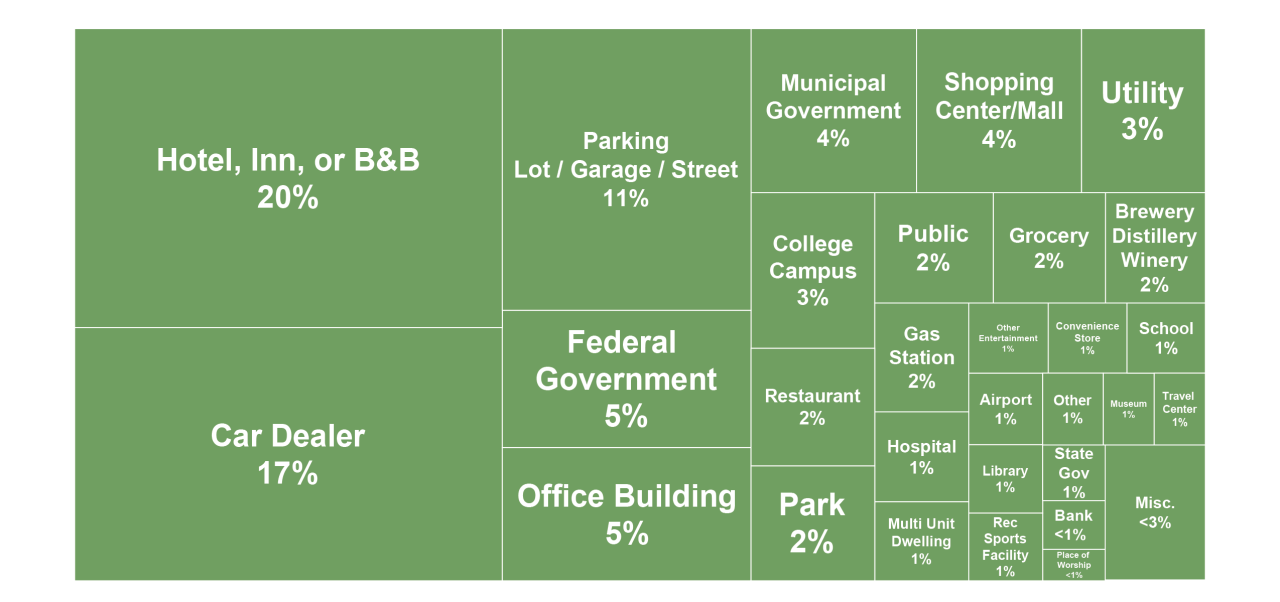
EV charging stations most likely to be found at hotels and car dealerships.
For EV stations with a designated facility type3, hotels, car dealers, and shopping malls were home to the greatest number of electric vehicle charging stations across the country in April 2023. Parking lots and garages, as well as federal government facilities followed close behind.
Tools you can use!
To explore more aspects of the alternative fuel stations dataset, you can visit the Alternative Fuel Station Locator tool at https://afdc.energy.gov/stations#/find/nearest.
The Joint Office of Energy and Transportation offers a host of useful resources including an electric vehicle charging station locator app for iPhone and Android as well as maps and other tools at https://driveelectric.gov/resources/.
The dataset used in this article is available for download and use from the National Transportation Atlas Database (NTAD) at: https://geodata.bts.gov/datasets/usdot::alternative-fueling-stations/explore.
1 Statistics from the Alternative Fuels Data Center (AFDC), https://afdc.energy.gov/data/10332
2 Federal Highway Administration (FHWA), Highway Statistics 2020, Functional System Lane-Length – 2020 Lane Miles, Table HM-60, https://www.fhwa.dot.gov/policyinformation/statistics/2020/hm60.cfm
3 About 44,000 EV stations did not have a designated facility type as of April 1, 2023.