5.3 Million Miles to Gold; the U.S. Olympic Team Travels to 2021 Tokyo Games amid a Summer of Air Travel Challenges
Data spotlights represent data and statistics from a specific period of time, and do not reflect ongoing data collection. As individual spotlights are static stories, they are not subject to the Bureau of Transportation Statistics (BTS) web standards and may not be updated after their publication date. Please contact BTS to request updated information.
The U.S. Olympic and Paralympic teams have more than 800 athletes competing in the Tokyo games in events from American Canoe to Wrestling. Airline data the Bureau of Transportation Statistics collects tells us that just getting the athletes to Japan is an Olympian feat in its own right. From aircraft and labor shortages, to weather and fires, to the surging demand for seats, the 2021 summer travel season has posed a number of challenges for U.S. flyers.
The U.S. Olympic and Paralympic teams are traveling a combined distance of 5.3 million miles to Tokyo.
Using the athlete list for Team USA and gathering hometowns or current locations, we calculated the distance to Tokyo measured as the bird (or the archery arrow) flies.
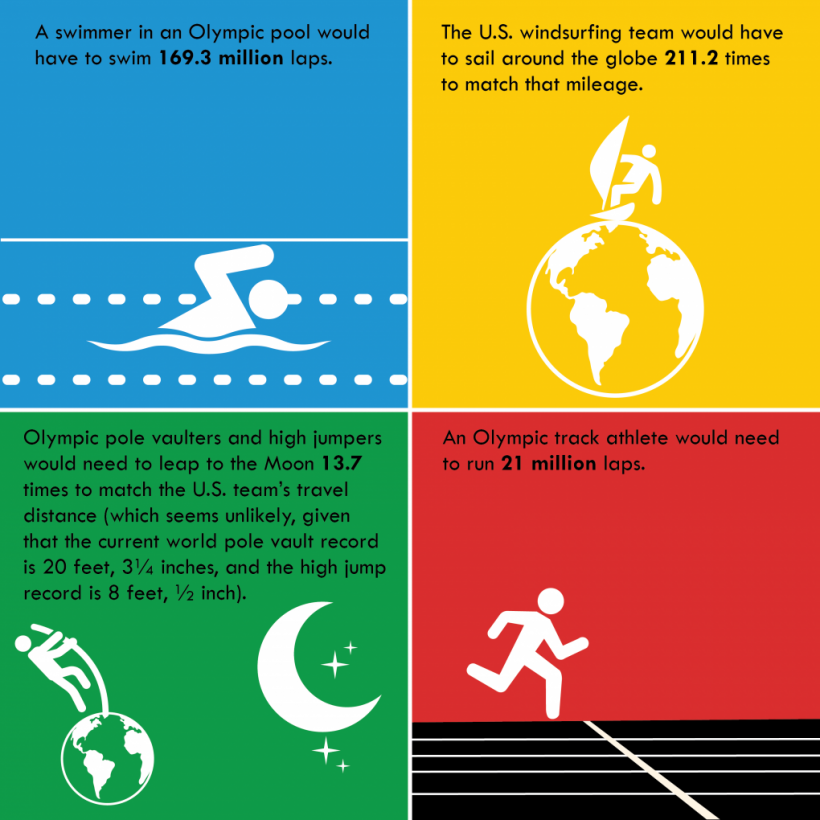
Add up the individual lines in the map above, and you’ll discover that your 846 U.S. athletes are traveling a total of 5,259,366 miles! And, to give you an idea of just how far that is:

Here’s hoping Team USA’s flights aren't delayed or canceled!
BTS collects and analyzes on-time and cancellation data for U.S. flights by airport, city, and state. The chart below shows data from January through May 2021 to see which states have the fewest delays and how long those delays are, on average. If you’re an American Olympian flying out of Vermont, you’ve got the best chance for an on-time departure.
Source: BTS Office of Airline Information
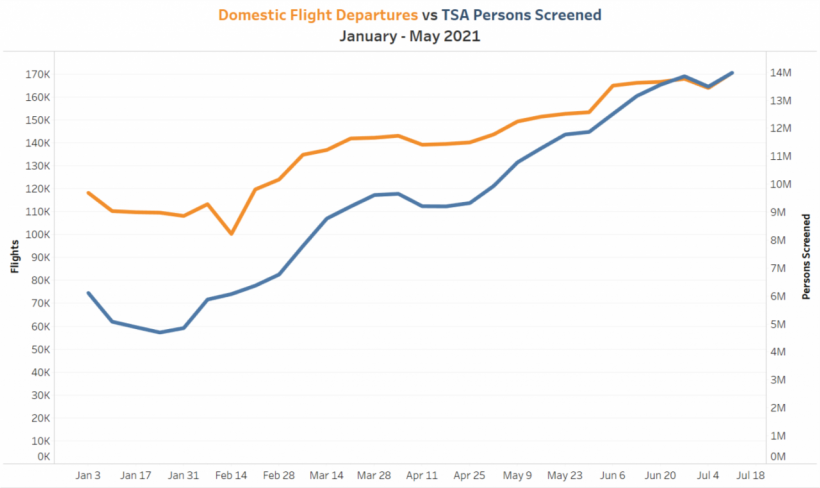
Airlines adding flights more slowly than passenger demand is increasing...
As the chart below suggests, the level of passenger demand (represented here by the number of persons screened each week by TSA) has increased at a faster pace than airlines have added flights to their schedules. That spells fuller flights, which can complicate an airline’s ability to meet its schedule.

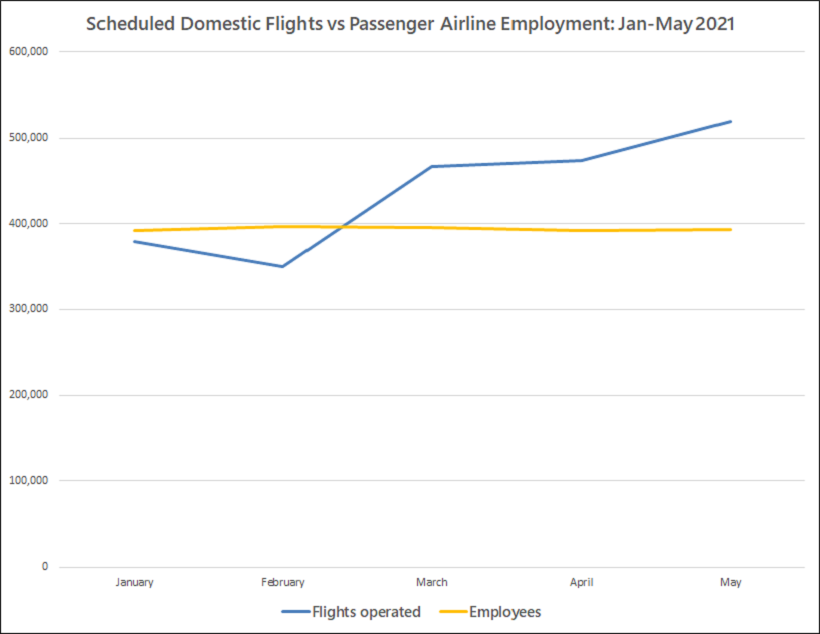
...And adding flights faster than employees
Data BTS receives from U.S. passenger airlines indicates they added back domestic flights to their schedules faster than they added back employees for the first few months of this year. More research will be needed to understand whether increasing the number of flights and passengers without increasing employees puts pressure on an airline’s ability to meet its schedule.

Are flight cancellations rising with increased summer air travel?
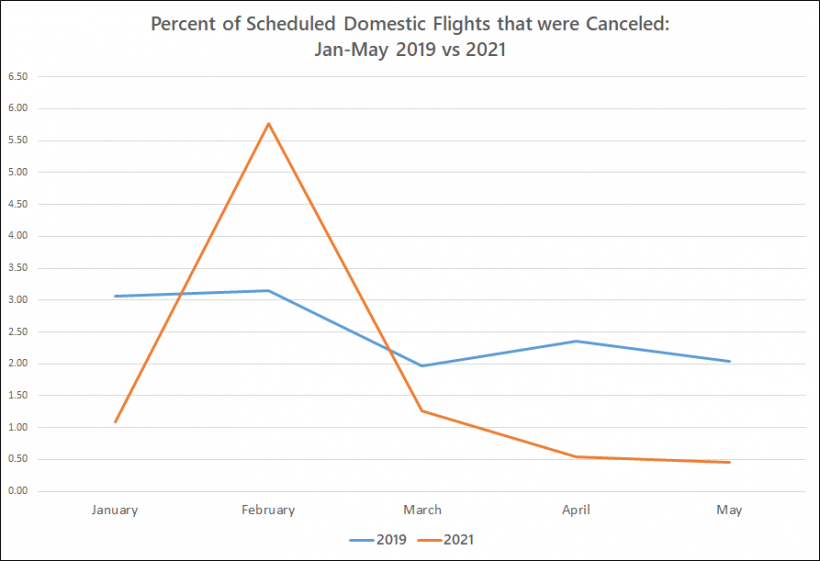
Although we’ve been reading media anecdotes about flight cancellations this summer, the most recent 12 months of data BTS has (June 2020-May 2021) show cancellation rates lower than the same months in 2019—with the exception of February 2021 when severe weather caused an increase in cancellations.
The chart below shows cancellation rates for the first five months of this year in relation to the same months in 2019.

Planning summer travel?
If you’re planning a trip --even if you’re not an Olympian-- check out our pages on tarmac wait times and chronically delayed flights; then head over to Transtats for a more complete look at airlines, passengers, prices and more.
