Pandemic Alters Profile of U.S.-North America Trade and Border Crossings
Data spotlights represent data and statistics from a specific period of time, and do not reflect ongoing data collection. As individual spotlights are static stories, they are not subject to the Bureau of Transportation Statistics (BTS) web standards and may not be updated after their publication date. Please contact BTS to request updated information.
Total Value of Transborder Freight Drops in 2020 but Recovers by 2022
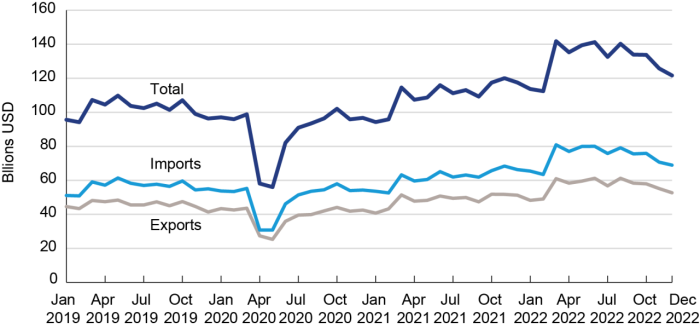
Manufacturing and logistics sectors across North America are highly linked and interdependent. America’s land borders with Canada and Mexico are the busiest and most economically vital conduits for North American supply chains, with about $3 billion in daily cross-border trade. In 2022, the value of total U.S.-international trade was $6.5 trillion, of which U.S. trade with Canada and Mexico accounted for $1.6 trillion or 24 percent. Freight flows in chemicals, vehicles, computer parts, and more support a range of industries from autos and energy to agriculture. The changes observed in trade across our northern and southern border since the coronavirus pandemic provide a glimpse into how economic sectors have changed.
Before the pandemic, in 2019, the U.S. had $1.2 trillion in trade with Canada and Mexico. The total weight of that trade was 579.4 million tons. Although freight traffic was not affected by pandemic-related border closures, overall economic activity slowed in 2020 following pandemic lockdowns in all three nations. From 2019 to 2020, the value of total trade with Canada and Mexico declined by 13.3 percent to $1 trillion. The weight of goods crossing the border decreased 3.7 percent to 557.7 million tons.1
In 2022, as the pandemic waned and economic activity recovered, the value of U.S. trade with Canada and Mexico hit $1.6 trillion, up 50 percent from 2020 and 25 percent from pre-pandemic 2019.
Figure 1: Value of Imports and Exports to and from Canada and Mexico 2019-2022
Source: Bureau of Transportation Statistics, North American Transborder Freight Data, available at https://www.bts.gov/transborder
Price Increases in Oil and Mineral Fuels Drive Associated Increases in Value of Vessel and Pipeline Freight
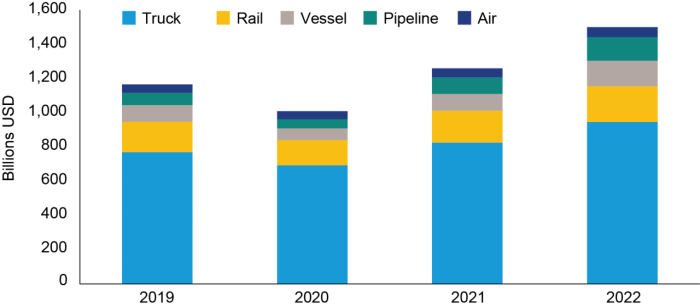
Much of the decline in trade value from 2019 to 2020 can be attributed to a decrease in the value of freight transported by vessel (down 28.2 percent) and pipeline (down 26.6 percent), most of which is oil and mineral fuels. The value of freight by rail decreased by 16.9 percent, and truck by 10 percent. Air freight was the least impacted with a decrease in value of only 6.1 percent.
In 2021, freight flows by all modes began to recover from their pandemic lows of 2020, increasing in value by 22.3 percent. Vessel and pipeline freight flows increased in value the most, by 43.2 and 83.4 percent respectively, primarily due to the increased dollar-value of oil but also because of increased demand as businesses and the larger economy began to reopen and travel resumed.
In 2022, freight by rail, vessel, and pipeline grew disproportionately as the dollar value of fuel and energy commodities spiked. The value of U.S. freight flows with Canada and Mexico peaked in March with an all-time high of $142 billion for the month. By December, the value of trade was down to $121 billion, a 14 percent decrease. The declining value of oil in later 2022 was a contributing factor, with the value of pipeline freight decreasing by more than 50 percent from May to December 2022.
Table 1: Value of U.S.-Canada/Mexico Trade by Mode, 2019-2022

Source: Bureau of Transportation Statistics, North American Transborder Freight Data, available at https://www.bts.gov/transborder
Figure 2: Value of U.S.-Canada/Mexico Trade by Mode 2019-2022
Source: Bureau of Transportation Statistics, North American Transborder Freight Data, available at https://www.bts.gov/transborder
Border Crossings from Canada See Recovering Truck Traffic while Truck Crossings from Mexico Continue to Outpace 2019
In 2019, the U.S. had 370,200,015 million incoming land border crossings with Canada and Mexico, 94,661,870 with Canada, and 275,538,145 with Mexico. In 2020, the pandemic induced a decline in total crossings with Canada and Mexico of 45.8 percent to 200,531,716. Crossings started to rebound in 2021 with 224,159,112 total crossings, followed by 310,273,484 in 2022. Nearly three years after the start of the pandemic, border crossings in 2022 had not fully rebound to their 2019 all-time highs.
Table 2: Number of U.S.-Canada/Mexico Border Crossings: 2019-2022

Note: This data only covers legal crossings. For data on illegal crossings, please refer to Customs and Border Protection Data Portal: https://www.cbp.gov/newsroom/stats/cbp-public-data-portal.
Source: Bureau of Transportation Statistics, Border Crossing/Entry Data, available at https://www.bts.gov/content/border-crossingentry-data
Table 3: Number of U.S.-Canada/Mexico Border Crossings by Mode: 2019-2022

Source: Bureau of Transportation Statistics, Border Crossing/Entry Data, available at https://www.bts.gov/content/border-crossingentry-data
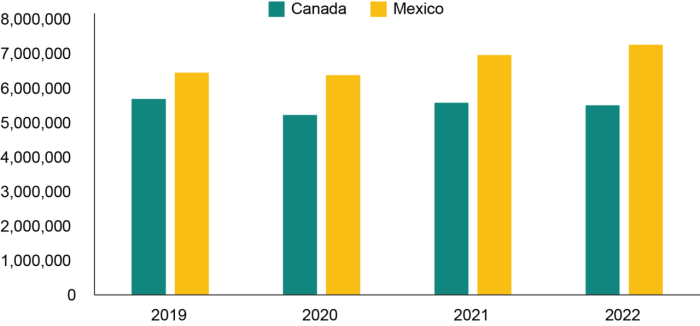
Comparing 2019 to 2020, combined North American truck crossings declined by 5.1 percent. Truck crossings from Mexico dipped by 1.1 percent in 2020 from 2019, while trucks from Canada declined by 8.2 percent. By the end of 2022, truck crossings from Canada had not fully recovered to their 2019 levels, still down 3.3 percent. Truck crossings from Mexico have continued steady growth since 2020, with 2022 crossings exceeding 2019 by 12.5 percent.
In 2022, trucks transported $948 billion in freight over our northern and southern borders. The top commodities were computers and machinery valued at $183 billion, followed by electrical machinery at $145 billion and vehicles and parts at $125 billion. The top truck port was Laredo which handled $238 billion of freight with Mexico, followed by Detroit at $115 billion and El Paso/Ysleta at $73 billion.
Figure 3: Truck Crossings from Canada and Mexico into the U.S. 2019-2022
Source: Bureau of Transportation Statistics, Border Crossing/Entry Data, available at https://www.bts.gov/content/border-crossingentry-data
Passenger Crossings still Awaiting Full Recovery from Border Closures
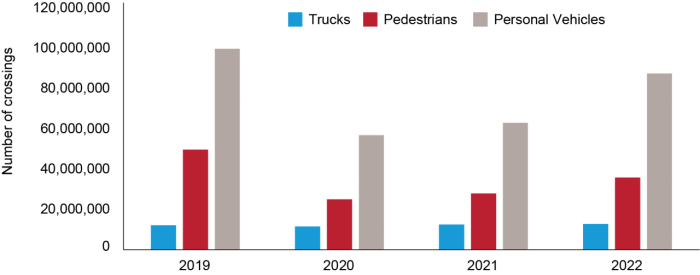
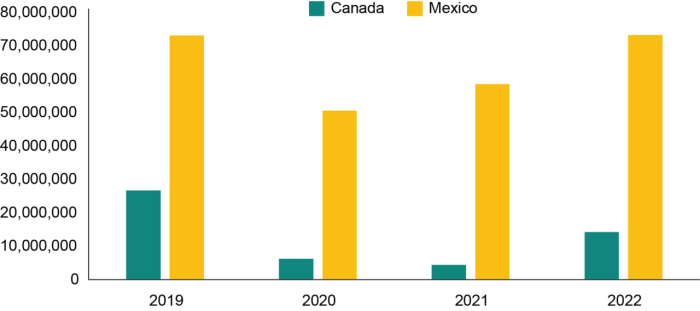
From 2019 to 2020, pedestrian and personal vehicle crossings decreased by an astonishing 98.4 and 75.6 percent respectively. Crossings began to recover in 2022, but three years after the start of the pandemic, pedestrian and personal vehicle crossings in 2022 lagged 2019 by 27.8 and 12.3 percent respectively.
Figure 4: U.S.-Canada/Mexico Border Crossings by Mode
Source: Bureau of Transportation Statistics, Border Crossing/Entry Data, available at https://www.bts.gov/content/border-crossingentry-data
One clear trend observed is the sharp difference in decline of personal vehicle and pedestrian crossings from Canada compared with Mexico. In 2021, personal vehicle crossings from Canada fell 87.5 percent from 2019. In the same time period, personal vehicle crossings from Mexico went down by 29.5 percent. Meanwhile, pedestrian crossings from Canada dropped by 92.8 percent whereas pedestrian crossings from Mexico declined by only 43.2 percent.
Table 4: Number of U.S.-Canada Border Crossings by Mode: 2019-2022

Source: Bureau of Transportation Statistics, Border Crossing/Entry Data, available at https://www.bts.gov/content/border-crossingentry-data
Table 5: Number of U.S.-Mexico Border Crossings by Mode: 2019-2022

Source: Bureau of Transportation Statistics, Border Crossing/Entry Data, available at https://www.bts.gov/content/border-crossingentry-data
Figure 5: Personal Vehicle Crossings from Canada and Mexico: 2019-2022
Source: Bureau of Transportation Statistics, Border Crossing/Entry Data, available at https://www.bts.gov/content/border-crossingentry-data
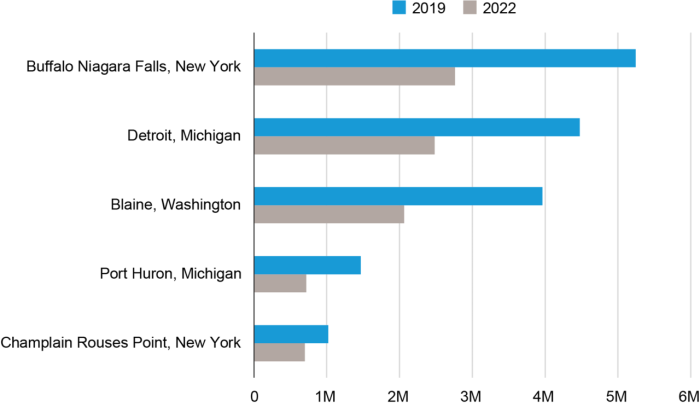
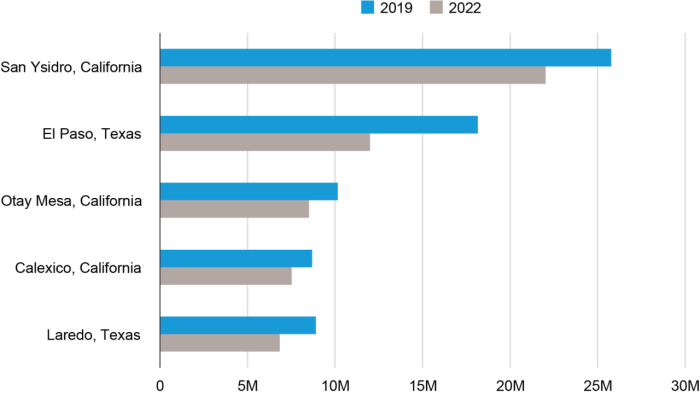
The land border travel declines of 2020 did not change the rankings of top ports along the U.S.-Canada or U.S. Mexico border between 2019 and 2022.
Figure 6: Top U.S.-Canada Ports of Entry for Pedestrians and Personal Vehicles: 2019 vs 2022
Source: Bureau of Transportation Statistics, Border Crossing/Entry Data, available at https://www.bts.gov/content/border-crossingentry-data
Figure 7: Top U.S.-Mexico Ports of Entry for Pedestrians and Personal Vehicles: 2019 & 2022
Source: Bureau of Transportation Statistics, Border Crossing/Entry Data, available at https://www.bts.gov/content/border-crossingentry-data
BTS offers a wide range of statistical information on border crossings and transborder freight. In addition to more detailed Border Crossing data, BTS also collects detailed value and weight statistics on imports and exports of commodities by border crossing, mode of transportation, and other variables on our Transborder Freight page.
