
Philadelphia Bridge Collapse Focuses Attention on I-95 Corridor Freight Movements
Data spotlights represent data and statistics from a specific period of time, and do not reflect ongoing data collection. As individual spotlights are static stories, they are not subject to the Bureau of Transportation Statistics (BTS) web standards and may not be updated after their publication date. Please contact BTS to request updated information.
Trucks carry millions of tons of freight and billions in dollar-value through the region annually
The closure of a portion of I-95 in Philadelphia following the bridge collapse on June 11 focused attention on the importance of the I-95 corridor for freight movement. In 2021, trucks carried 21 million tons of freight worth $104 billion between major goods producing and consuming areas to the north and south of the Philadelphia region.
Ranking of commodities carried by trucks in Philadelphia region vary by weight and value
| Rank | Commodity Description | 1,000 Tons |
|---|---|---|
| 1 | Dairy products, coffee, frozen vegetables, and other foodstuffs | 2,373 |
| 2 | Mixed freight (e.g. office supplies, hardware, restaurant supplies) | 1,900 |
| 3 | Non-metal mineral products | 1,728 |
| 4 | Meat & seafood | 1,204 |
| 5 | Plastics & rubber | 1,173 |
| 6 | Waste & scrap | 1,159 |
| 7 | Motorized vehicles | 871 |
| 8 | Pharmaceuticals | 803 |
| 9 | Newsprint & paper | 777 |
| 10 | Chemical products | 752 |
| Total 2021 Tons, all commodities (units: 1,000s of tons): | 20,863 | |
Table 1 shows the top 10 commodity categories moved by truck through the Philadelphia region by weight. The top commodity category has many of the products that can be found on grocery store selves. The third heaviest commodity category, nonmetallic mineral products, includes hydraulic cements, glass, ceramic products, and construction materials such as wallboards and concrete pipes.1
| Rank | Description | Value, millions of $ |
|---|---|---|
| 1 | Electronics | 11,210 |
| 2 | Motorized vehicles | 10,511 |
| 3 | Pharmaceuticals | 9,059 |
| 4 | Machinery | 7,375 |
| 5 | Mixed freight (e.g. office supplies, hardware, restaurant supplies) | 6,634 |
| 6 | Textiles & leather | 6,099 |
| 7 | Plastic & rubber | 5,801 |
| 8 | Miscellaneous manufactured products | 5,679 |
| 9 | Chemical products | 5,641 |
| 10 | Meat & seafood | 5,541 |
| Total 2021 Value, all commodities (units: $M USD, 2021 dollars): | 103,793 | |
Table 2 shows the top 10 commodity categories moved by truck through the Philadelphia region by monetary value. More than $11 billion dollars of electronics moved through the Philadelphia region on the I-95 corridor, slightly more than the value of the motor vehicles transported through the Philadelphia region on automobile transports.
The Bureau of Transportation Statistics (BTS) produced these tables using the Freight Analysis Framework (FAF), a comprehensive picture of freight movement to, from, and within the United States by all modes of transportation (www.bts.gov/faf). The FAF estimated freight flows among 132 domestic regions plus exports to and imports from 8 foreign regions. BTS combined FAF regions to the north and south of Philadelphia to estimate the volume and value of freight moving through the Philadelphia region on the I-95 corridor.2
Freight carriers have travel options to avoid bridge collapse delays
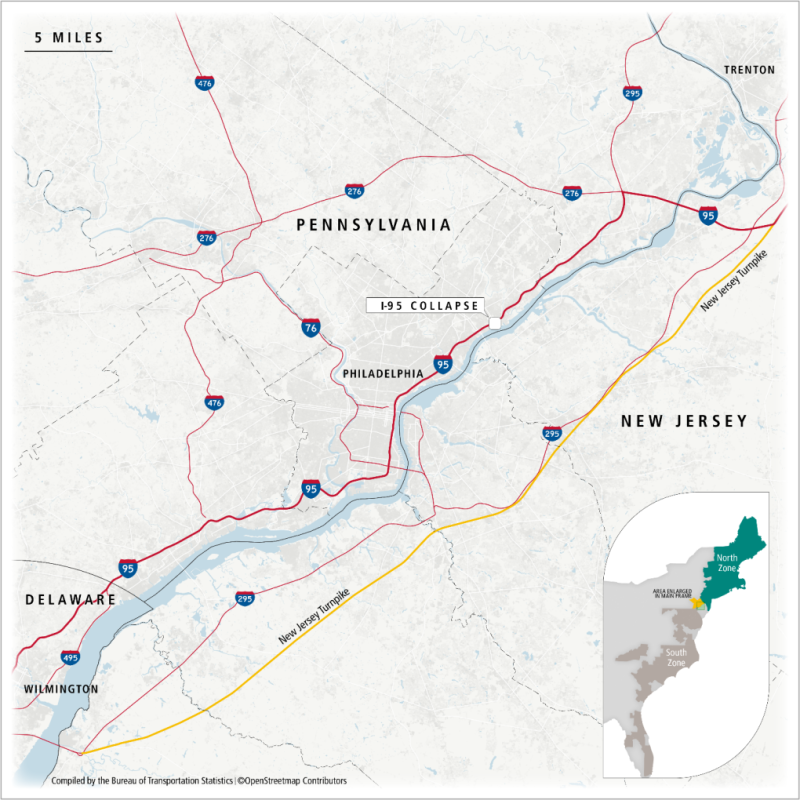
Fortunately for freight movement in the I-95 corridor, the bridge collapse occurred in a part of the highway network that has major alternative routes. As shown in the map, freight can travel around Philadelphia on the New Jersey Turnpike and I-295 without significant additions to distances traveled. The major disruption is to local freight movements between central Philadelphia its northeastern suburbs such as Bucks County. Displaced traffic from I-95 to I-295 and the New Jersey Turnpike may cause increased congestion and affect travel times of trucks.
1These commodity categories are based on the Standard Classification of Transported Goods described at https://www.bts.gov/sites/bts.dot.gov/files/docs/browse-statistical-products-and-data/surveys/commodity-flow-survey/210866/2017-cfs-commodity-code-sctg-manual.pdf.
2 Estimates of freight movements between areas north and south of Philadelphia on the I-95 corridor are based on the following aggregations of FAF regions. The North area combines the FAF regions for the New York, Connecticut, and New Jersey portions of the New York metropolitan area; Hartford and the rest of Connecticut; Albany, New York; the Boston metropolitan area; New Hampshire, Vermont, and Maine. The South area combines the FAF regions for the Delaware portion of the Philadelphia metropolitan area and the rest of Delaware; Baltimore; the DC, Maryland, and Virginia portions of the Washington metro area; the rest of Maryland; Richmond, VA; Virginia Beach-Norfolk, VA; Raleigh-Durham, NC; the rest of North Carolina; Charleston, SC, the rest of South Carolina; Savannah, GA; the Florida portion of Jacksonville; Orlando, FL; and Miami, FL.