Resumed Trade with China and Consumer Activity in Late Quarters Leaves Top U.S. Container Ports with Solid 2020
Data spotlights represent data and statistics from a specific period of time, and do not reflect ongoing data collection. As individual spotlights are static stories, they are not subject to the Bureau of Transportation Statistics (BTS) web standards and may not be updated after their publication date. Please contact BTS to request updated information.
In February and March 2020, America’s top maritime ports experienced a downturn in container activity as COVID-19 hit the nation. However, the resumption of shipping activity in later months, due to the reopening of China trade and pent-up U.S. consumer demand, left container port activity levels about even for the year.
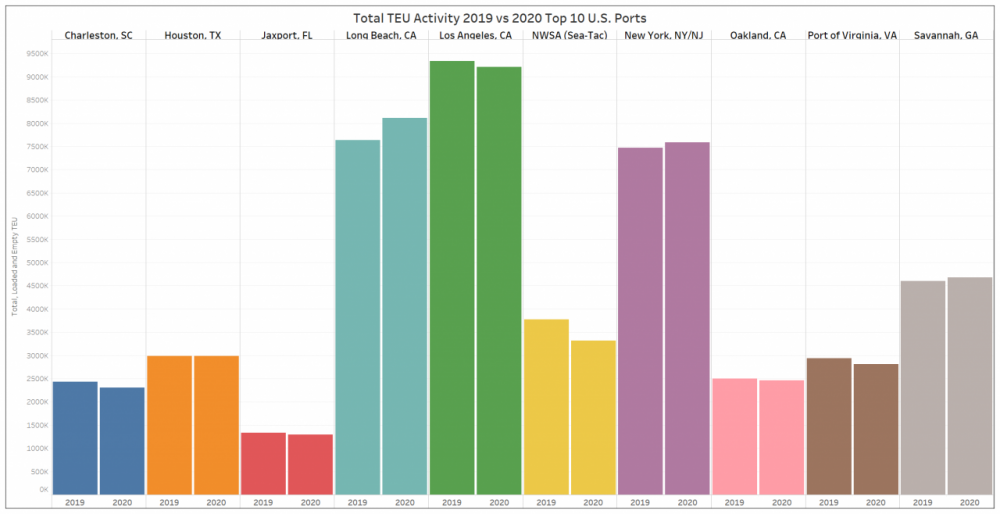
Combined, the top 10 container ports saw a decline in activity of 612K TEUs for the year or about 1.3%.
NOTE: TEUs, 20-foot equivalent units, are a unit of measure for container traffic equal to a standard shipping container. TEUs are commonly used when estimating container port or terminal activity.
The 10 U.S. ports with the most container activity account for 80% of all U.S. container port activity. As the paired bars below show, these ports had mixed outcomes in 2020 activity as compared with 2019. Most ports experienced reductions or increases in activity within plus or minus 5%. Two outliers were the Port of Long Beach, with a 6% increase in activity, and the jointly-operated ports of Seattle-Tacoma, with a combined decrease in activity of 12%.

SOURCE: U.S. Department of Transportation, Bureau of Transportation Statistics as of January 2021.
Maritime trade rebounds as China trade resumes, consumer confidence rises
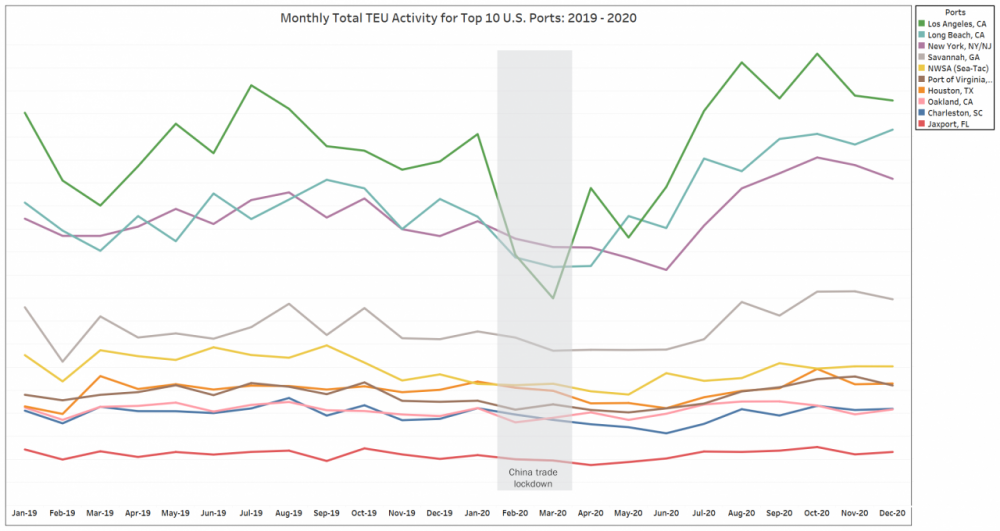
The line chart below shows the monthly activity levels of the same 10 container ports. The big dip in activity for the busiest ports in February coincides with the January 23 national lockdown in China. China is a major trading partner, accounting for almost 20 percent of imports to the United States.
With China reopening trade in April, activity at the top container ports was on the rise by the summer months. In the 3rd quarter, according to the Bureau of Economic Analysis (BEA), exports of goods grew by 24%, and imports grew by 19%. The Conference Board found consumer optimism continuing into the 4th quarter.
SOURCE: U.S. Department of Transportation, Bureau of Transportation as of January 2021.
For further, interactive insight into container port activity, visit our Monthly Container Port TEUs dashboard.

