Summer Mobility Heats Up: Passenger Airline Flights and Road Travel Increased Through Mid-July, Delta COVID-19 Variant Threatens Travel Gains
Data spotlights represent data and statistics from a specific period of time, and do not reflect ongoing data collection. As individual spotlights are static stories, they are not subject to the Bureau of Transportation Statistics (BTS) web standards and may not be updated after their publication date. Please contact BTS to request updated information.
In mid-July, the U.S. summer travel season was in full swing. The miles Americans traveled on the road were up, and the number of domestic passenger airline flights had also risen, with both measures approaching pre-pandemic levels. Amtrak ridership was also closing the difference from its pre-COVID normal.
As America turns its full attention to the Delta variant of COVID-19, some people might have scaled back their plans for August travel while some have seemed to proceed with planned vacations and others are already heading back to school. BTS has looked at travel data to establish a baseline for pre-Delta travel trends.
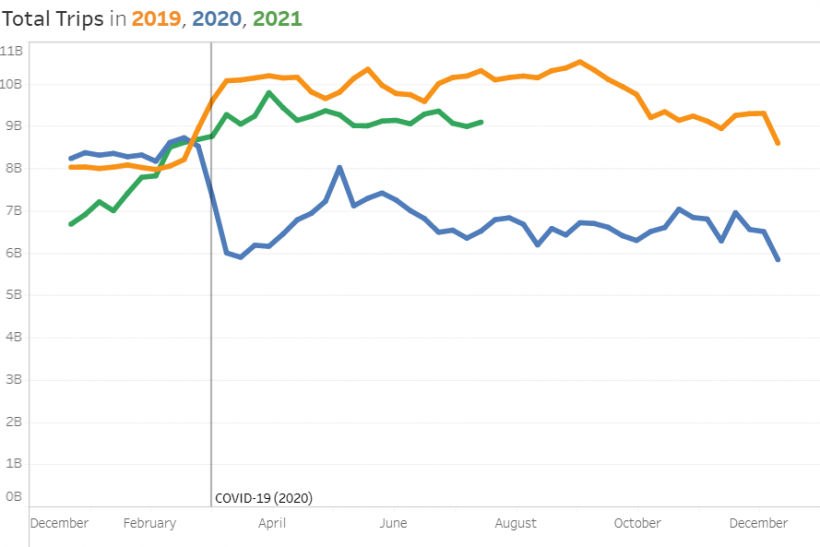
In the chart above, the green line representing the total number of trips taken in the U.S. this year indicates that general mobility in 2021 has approached that of 2019 (orange), closing the gap from 2020 (blue).
How will the Delta variant alter that trend? We’ll assess that in a future analysis.
U.S. roads are no longer less traveled.
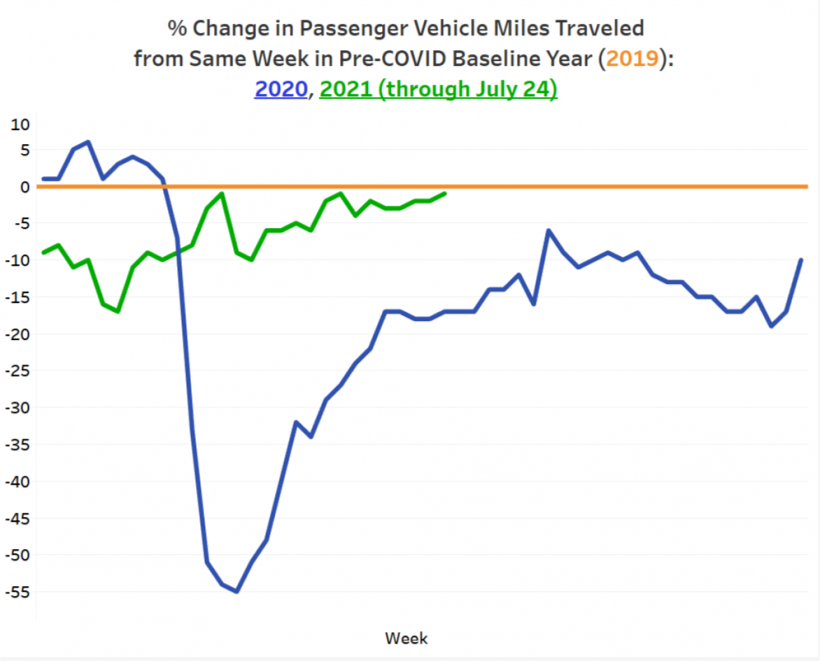
Through mid-July the trend in passenger vehicle highway miles traveled was moving closer and closer to matching pre-pandemic levels. As the chart below shows, passenger vehicle miles traveled (VMT) on U.S. highways in the most recent week (ending July 24) of 2021 (green) were only down 1% from the same week in 2019 (orange). Moreover, that week extends the 2021 trend of VMT moving closer and closer to baseline levels.

Source: FHWA
Because the above chart displays the percentage difference of like weeks from like weeks, it will be useful later for measuring the possible impact of the Delta variant in August and subsequent months.
Flyways also getting busier each month in 2021.
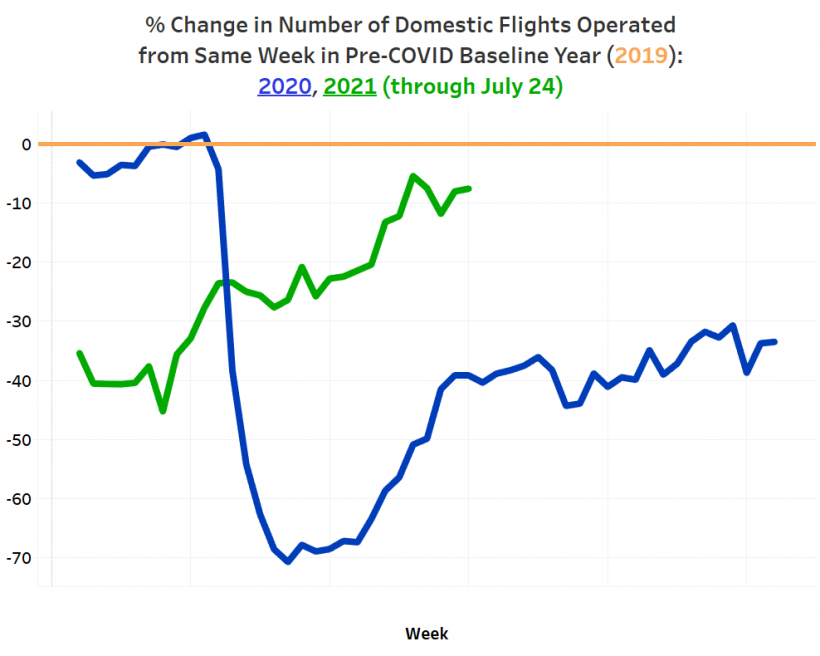
Similar to roadway travel, Americans have been taking to the sky for domestic flights in numbers approaching 2019 pre-COVID-19 levels. The chart below shows the percentage change from pre-pandemic 2019 for the number of domestic flights operated by airlines each week, and you’ll see that the trend in 2021 (green line) looks a lot like the green VMT line for 2021 in the above chart.

Source: BTS
Americans respond to Amtrak’s “All aboard!”
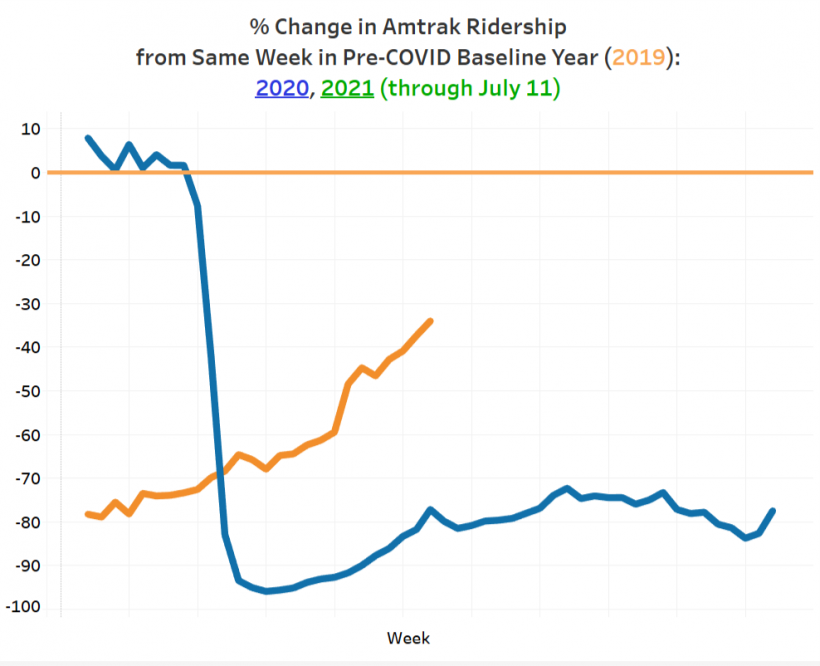
Highways and skies are not the only travel options Americans are flexing this summer. The chart below shows that ridership on Amtrak, America’s Passenger Railroad, has been increasing in 2021. Although it still has a ridership gap to overcome from pre-pandemic normal levels, the trend points to steady increases.

Source: Amtrak
Delta variant clouds the mobility picture.
With the Delta-caused increase in the number of new coronavirus infections and a subsequent return to mask mandates in some jurisdictions, American travel patterns will most likely change in the upcoming weeks. BTS will return with a follow-up analysis as the picture becomes clearer.

