TransBorder Data Mid-Year Report 2023
Data spotlights represent data and statistics from a specific period of time, and do not reflect ongoing data collection. As individual spotlights are static stories, they are not subject to the Bureau of Transportation Statistics (BTS) web standards and may not be updated after their publication date. Please contact BTS to request updated information.
The first half (January – June) of 2023 transborder crossing data is available! The Bureau of Transportation Statistics (BTS) compiled the tonnage and dollar value of commodities that moved across United States’ land borders with Canada and Mexico.
U.S. land borders with Canada and Mexico are critical to the economic resiliency of North America, consistently producing over $1 trillion in cross-border trade annually. In 2022, the value of total U.S.-international trade was $6.5 trillion, of which U.S. trade with Canada and Mexico comprised 24 percent of total international trade.
In 2022, U.S. freight flows with Canada and Mexico equaled $1.57 trillion dollars. The total weight of that trade was 654.0 million tons. Besides oil and energy products, autos, and electronics, the U.S., Canada, and Mexico are also each other’s largest trade partners of agricultural goods.
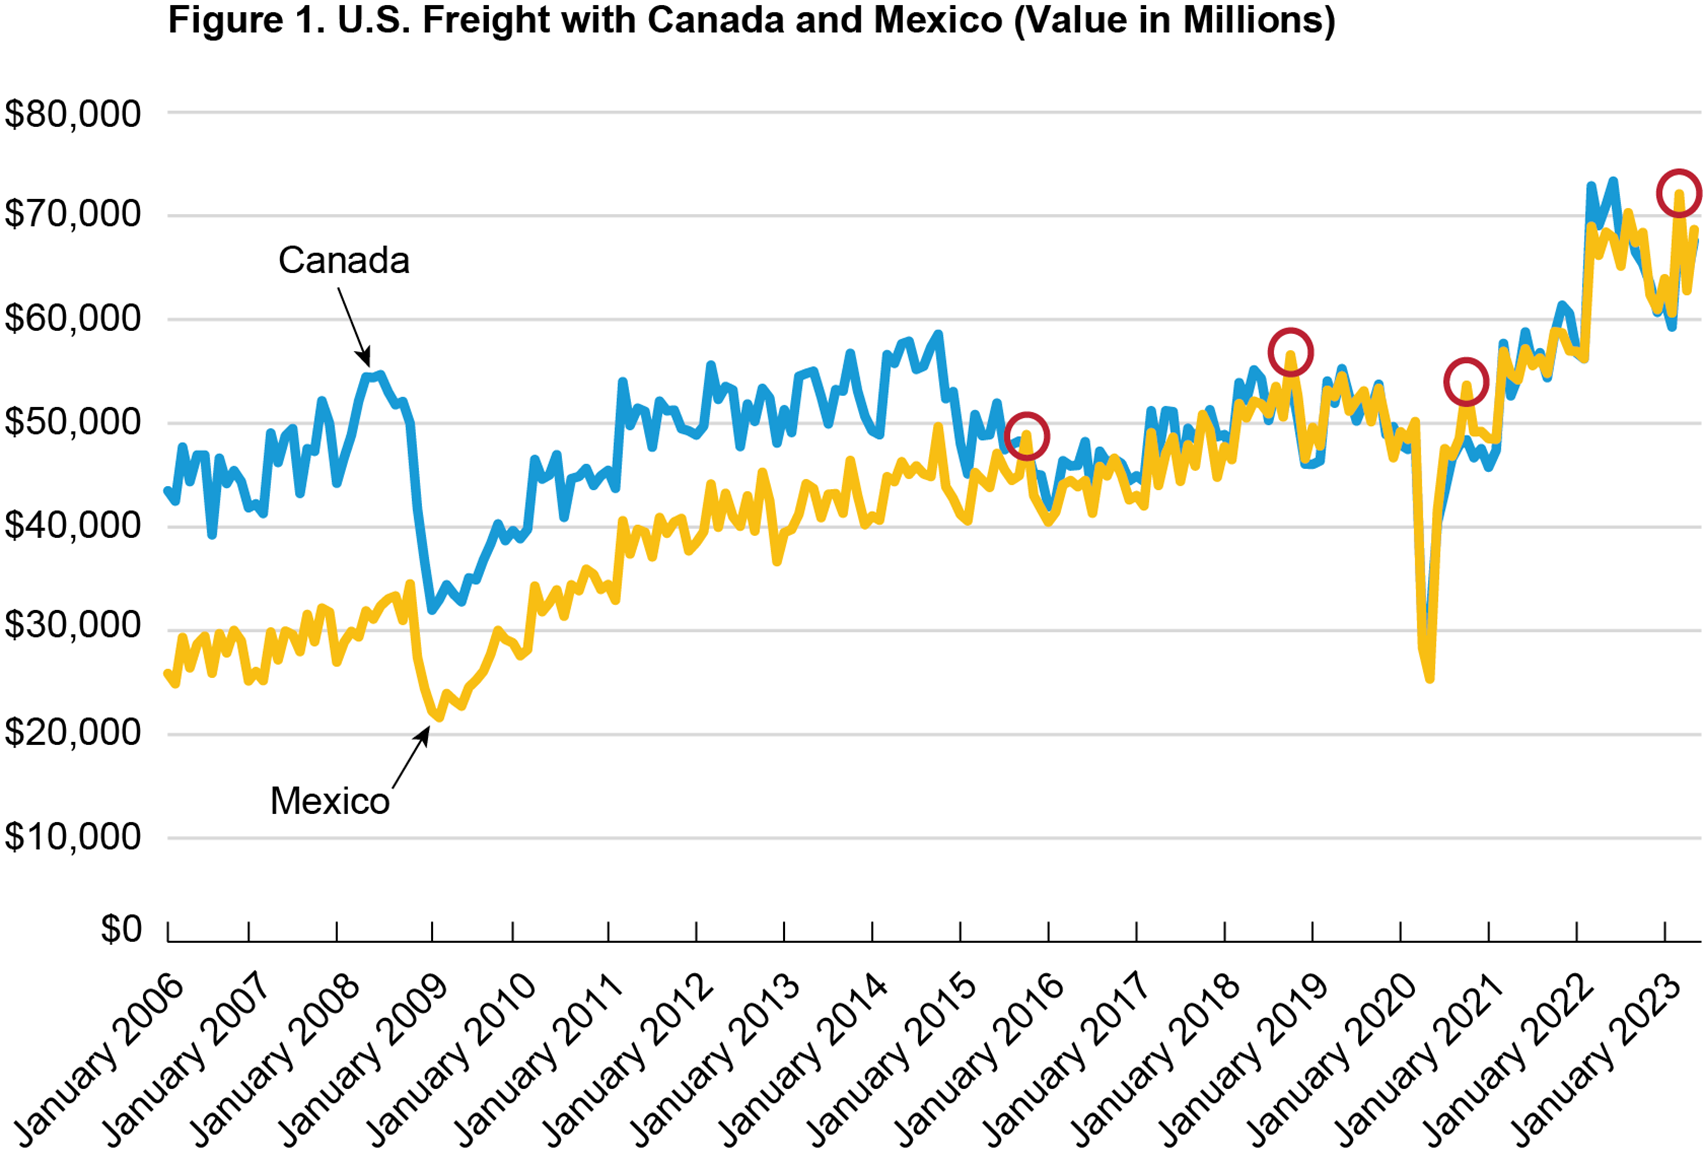
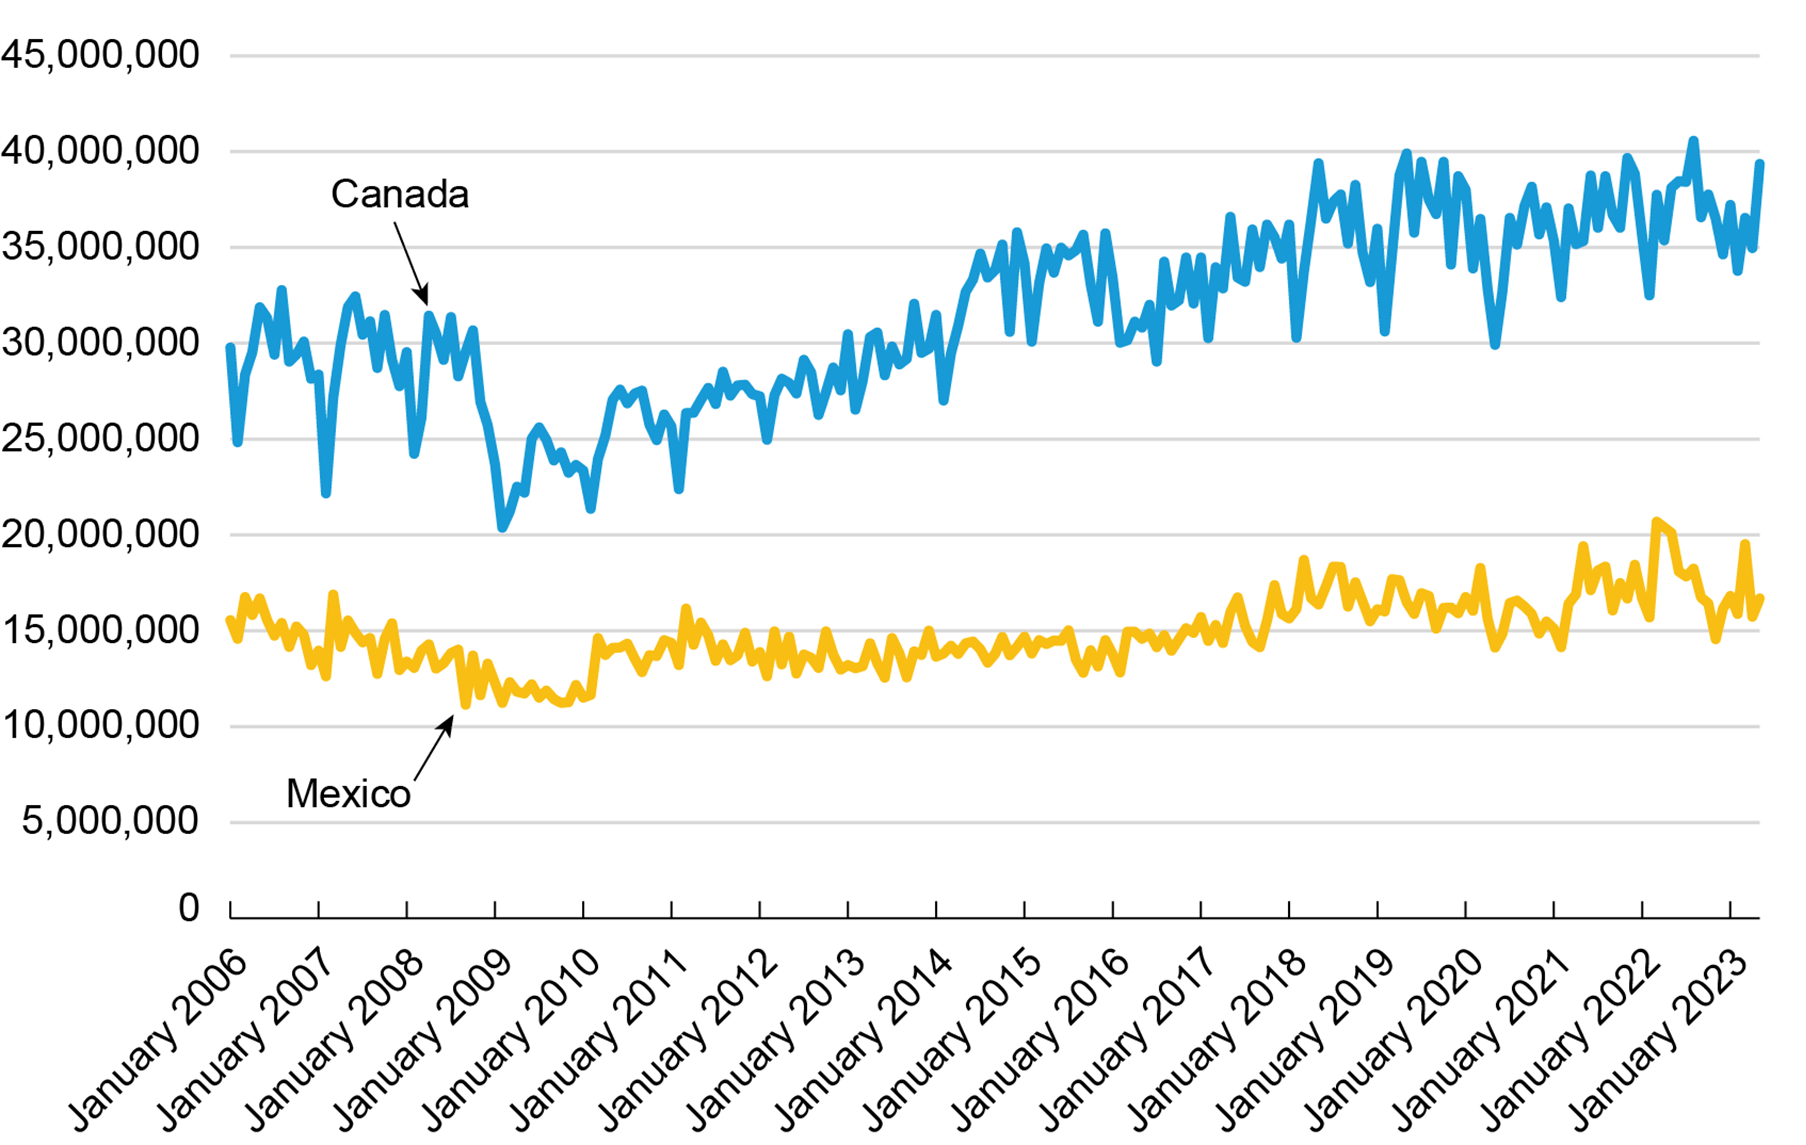
Since earlier than 2006, U.S. freight flows with Canada by value had commonly exceeded that with Mexico. However, starting in 2015, there have been several instances where U.S. freight with Mexico by value has surpassed that of Canada (Figure 1). This trend first appeared in October 2015 and has continued and extended through the COVID-19 pandemic. Interestingly, during this same period, the weight of freight flows with Canada has continued to exceed that of Mexico. U.S. freight flows with Canada by weight continue to be greater than Mexico (Figure 2). Canada has a higher weight-to-value ratio of commodities being traded such as vehicles, plastics, timber, and oil (Figure 3). On the other hand, Mexico has a higher value-to-weight ratio of commodities such as auto parts and agricultural products (Figure 4).
Since 2020, truck freight has grown faster than rail freight for U.S. trade with Canada and Mexico combined (Figure 5). In 2022, trucks shipped $948.0 billion worth of goods from and to Canada and Mexico, while rail accounted for $210.2 billion. From 2021 to 2022, the value of truck freight increased 14.5 percent while rail increased 12.7 percent. Pipelines carried $149.2 billion of mostly energy products like oil and gas, while waterborne vessels transported $138.8 billion of freight and air cargo carried $57.8 million.
Figure 6 expands the truck data to show freight moved by trucks coming to and from Mexico and Canada. U.S. freight transportation by truck with Mexico increased at a faster pace than Canada since 2020. From the pandemic lows in April 2020 to June 2023, freight by truck with Canada has increased from $17.8 billion to $39.5 billion while freight by truck with Mexico has grown from $20.8 billion to $49.0 billion.

Source: Bureau of Transportation Statistics, North American Transborder Freight Data, available at https://www.bts.gov/transborder
Figure 2 – U.S. Freight with Canada and Mexico (Weight in Short Tons)

Source: Bureau of Transportation Statistics, North American Transborder Freight Data, available at https://www.bts.gov/transborder
Figure 3. U.S. - Canada Freight Commodities 2015-2023: Weight and Value

Source: Bureau of Transportation Statistics, North American Transborder Freight Data, available at https://www.bts.gov/transborder
Figure 4. U.S. - Mexico Freight Commodities 2015-2023: Weight and Value

Source: Bureau of Transportation Statistics, North American Transborder Freight Data, available at https://www.bts.gov/transborder

Source: Bureau of Transportation Statistics, North American Transborder Freight Data, available at https://www.bts.gov/transborder

Source: Bureau of Transportation Statistics, North American Transborder Freight Data, available at https://www.bts.gov/transborder
