Transportation Commodity Brief U.S. Freight Flows with Canada and Mexico in Transportation Commodities: 2017 – 2024
Data spotlights represent data and statistics from a specific period of time, and do not reflect ongoing data collection. As individual spotlights are static stories, they are not subject to the Bureau of Transportation Statistics (BTS) web standards and may not be updated after their publication date. Please contact BTS to request updated information.
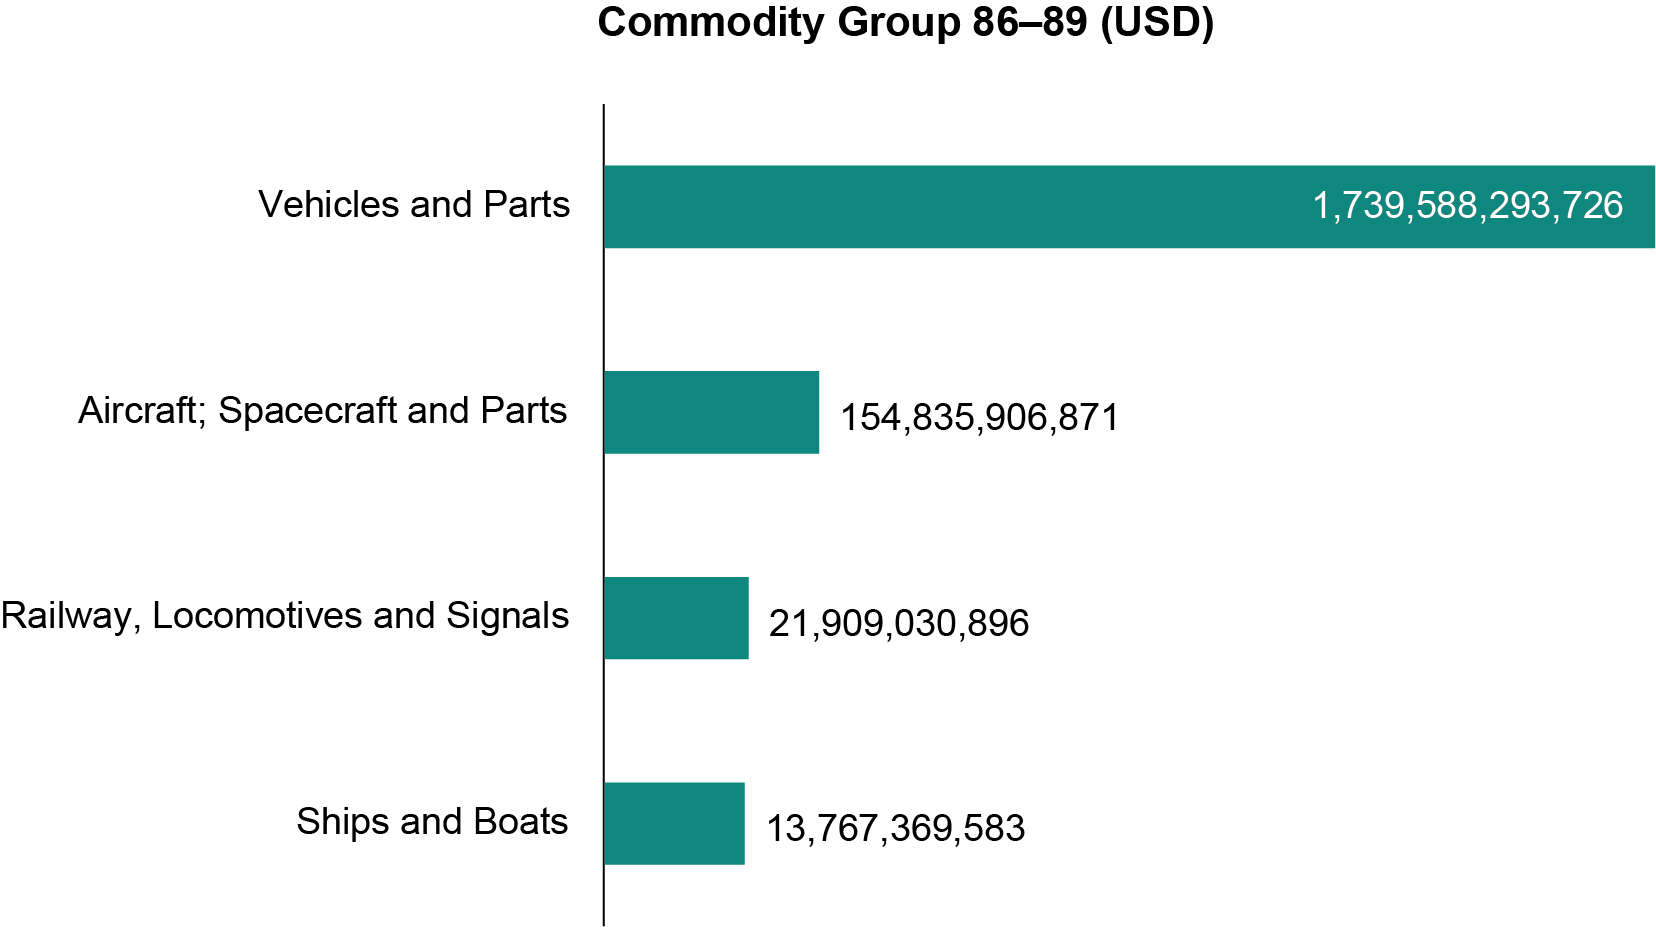
From 2017 to 2024, U.S. freight flows with Canada and Mexico totaled $1.9 trillion for the entire transportation commodity classification group of 86 – 89, which includes rail, vehicles, aircraft, and vessels. Within that commodity group, vehicles and parts (commodity group 87) comprised $1.7 trillion of freight shipments. Canada’s share of that freight was $768.9 billion while Mexico’s was $970.7 billion. The breakdown of bidirectional trade with Canada was roughly even with 50.7% in exports and 49.3% in imports. Mexico’s breakdown was 17.8% in exports and 82.2% in imports.
|
Commodity Group |
Export % |
Import % |
Total % |
USD (actual) |
|
87 Vehicles and parts |
32.4 |
67.6 |
90.10% |
1,739,588,293,726 |
|
88 Aircraft; Spacecraft and Parts |
61.8 |
38.2 |
8.00% |
154,835,906,871 |
|
86 Railway, Locomotives and Signals |
74.9 |
25.1 |
1.10% |
21,909,030,896 |
|
89 Vessels, Ships and Boats |
54.5 |
45.5 |
0.70% |
13,767,369,583 |
Note: The data in this table represent values only for these four commodities.
Following the outbreak of the pandemic in March 2020, freight activity in transportation commodities fell by 84.7% in Canada and 78.1% in Mexico. In April 2020, U.S. freight with Canada printed $1.1 billion and 2.2 billion with Mexico from $7.5 billion and $9.8 billion in the prior month respectively. Prior to the pandemic, the distribution of freight flows in vehicles and parts with Canada and Mexico was about the same, ranging from $6 to $10 billion per month from 2017 to April 2020. However, since the pandemic, Mexico has emerged to lead Canada by an increasing wide margin with a September 2024 value of $14.3 billion versus $9.4 billion respectively.
This shift is noteworthy, while it is not clear what is triggering the divergence in the value of U.S. freight flows from Canada to Mexico in the vehicles and parts commodity group. This trend is not apparent in the other three transportation commodity categories such as railways, aircraft, or ships. A separate chart breakdown by dollar value for each commodity group is listed below to demonstrate this point.
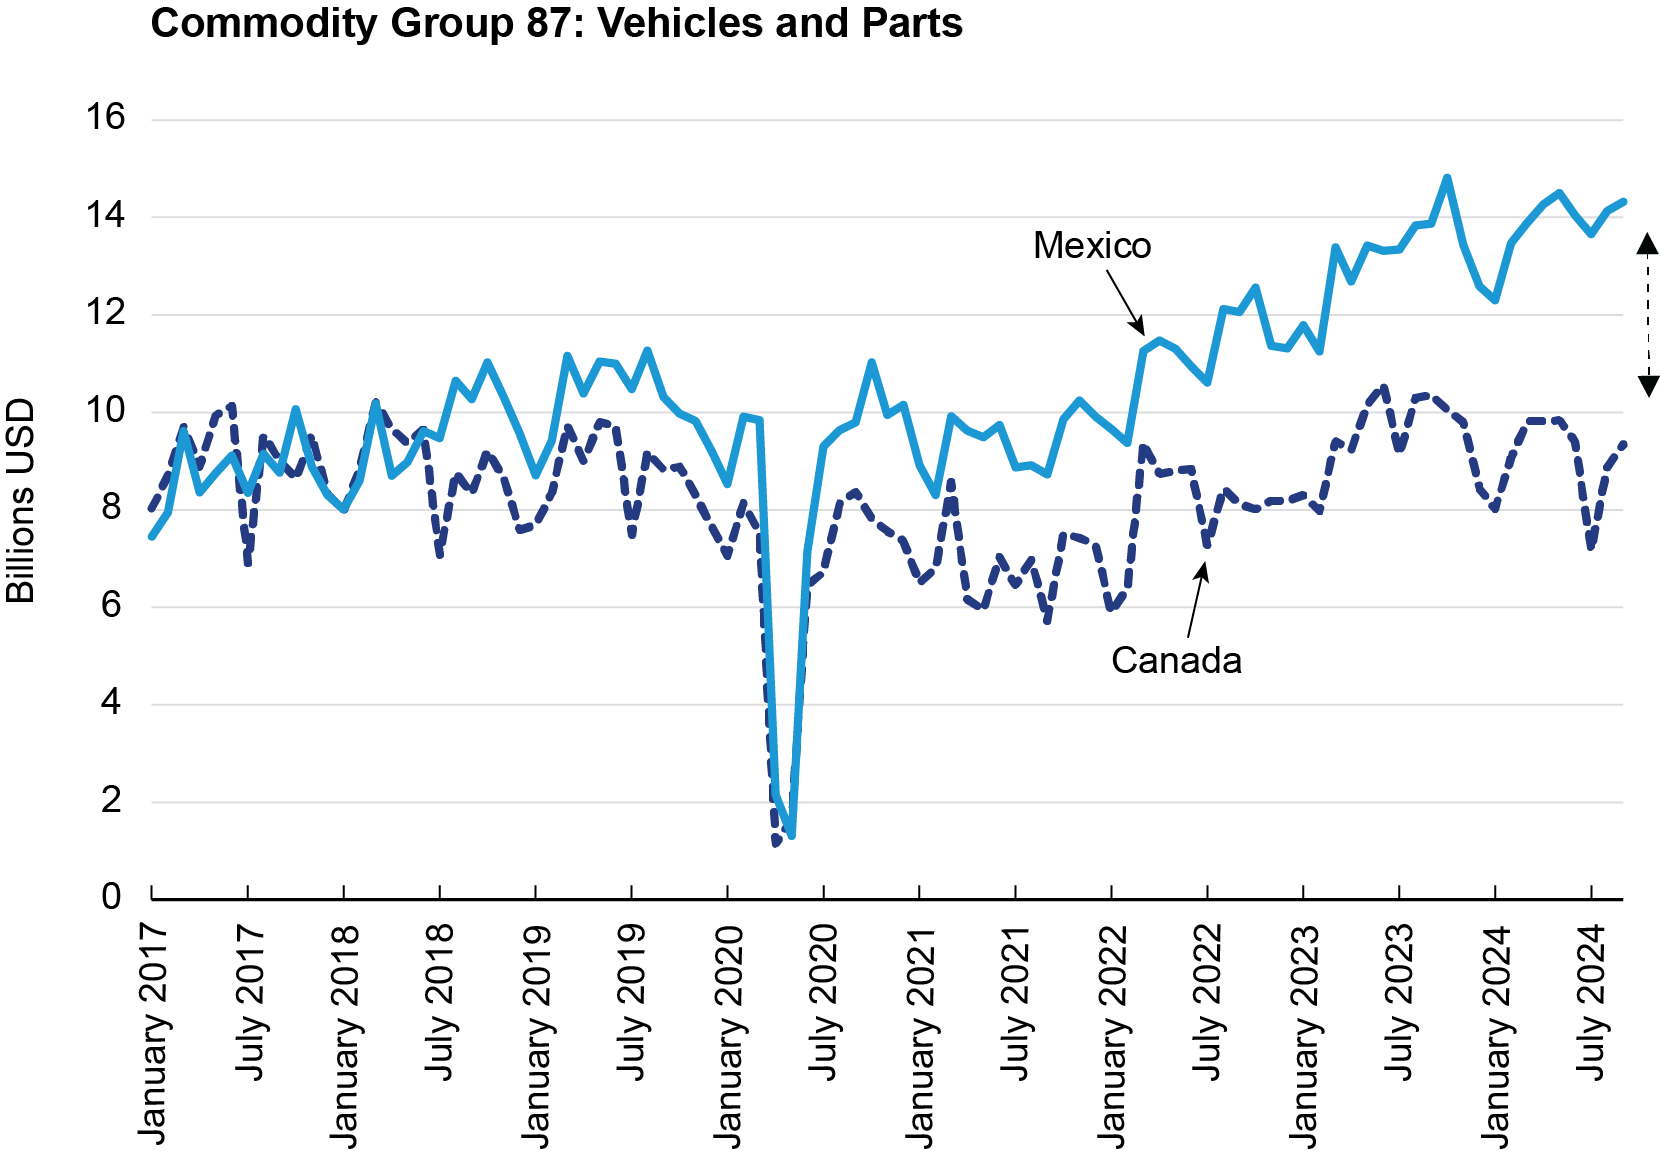
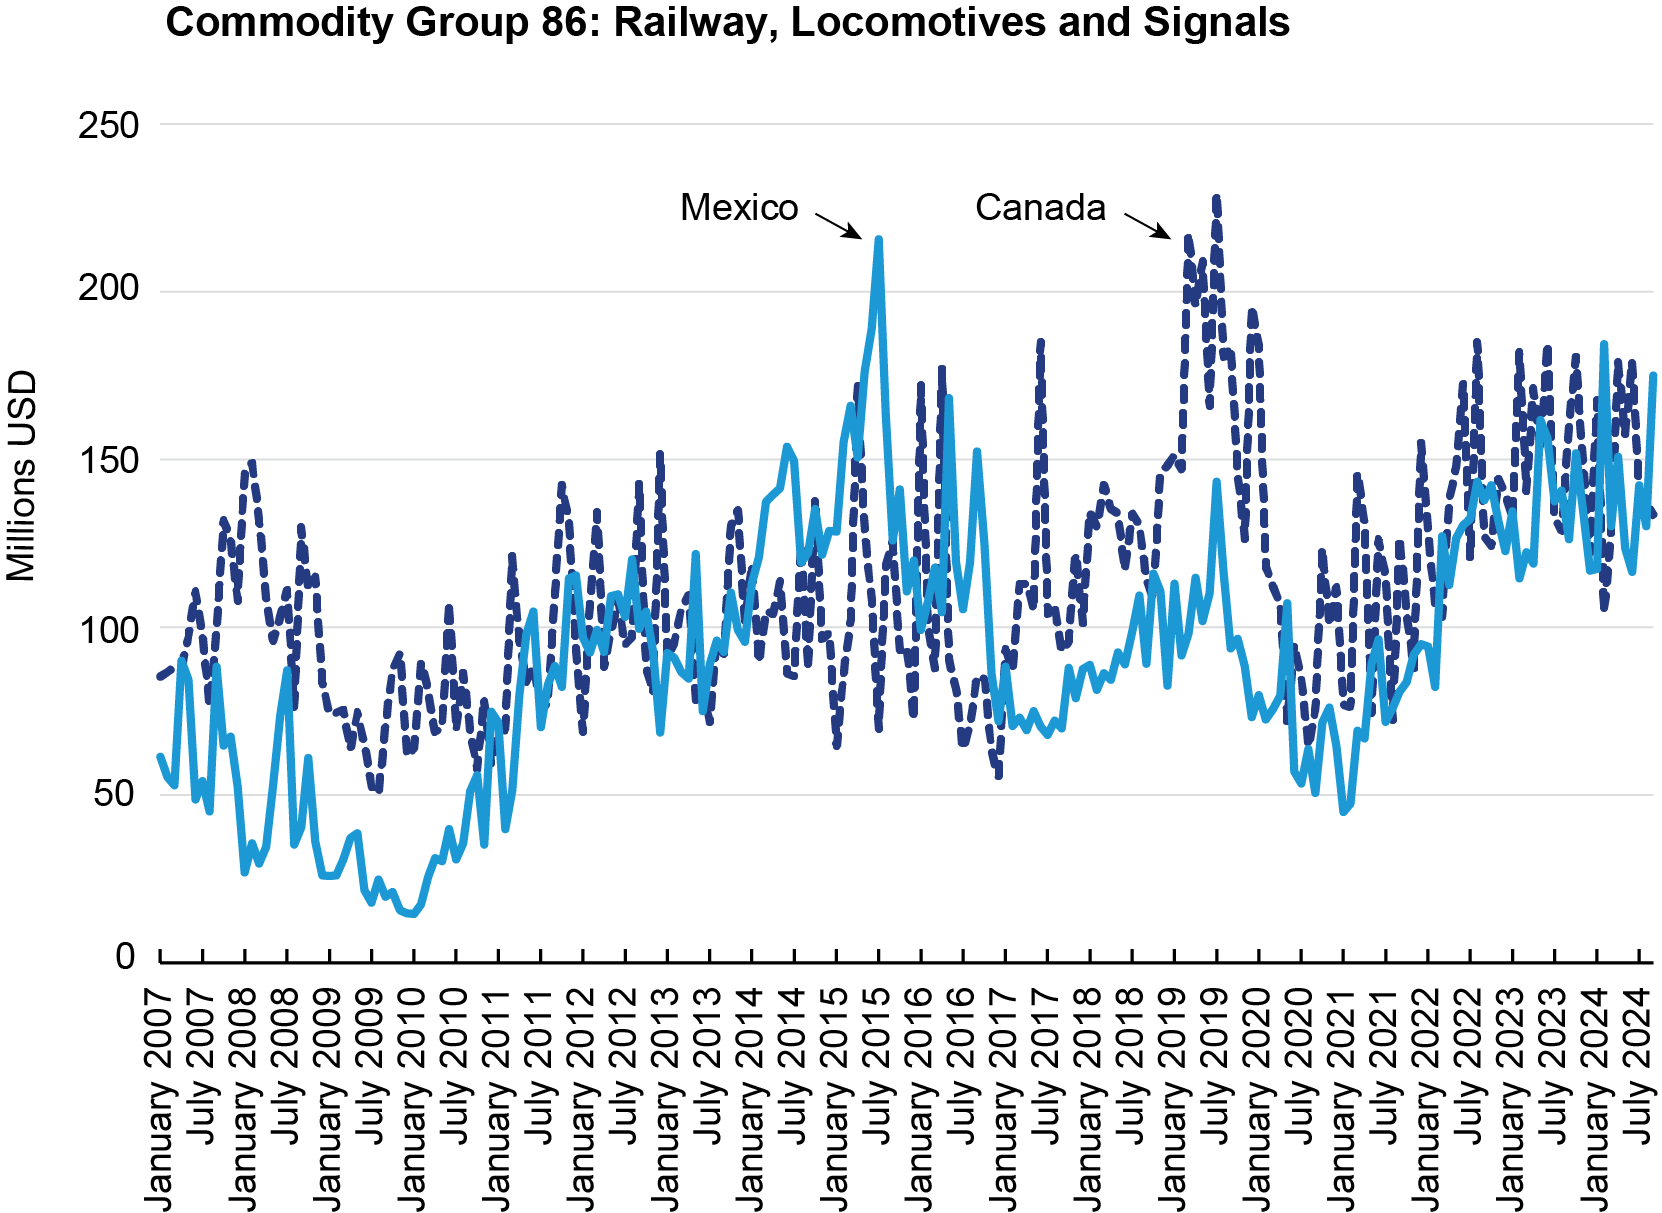
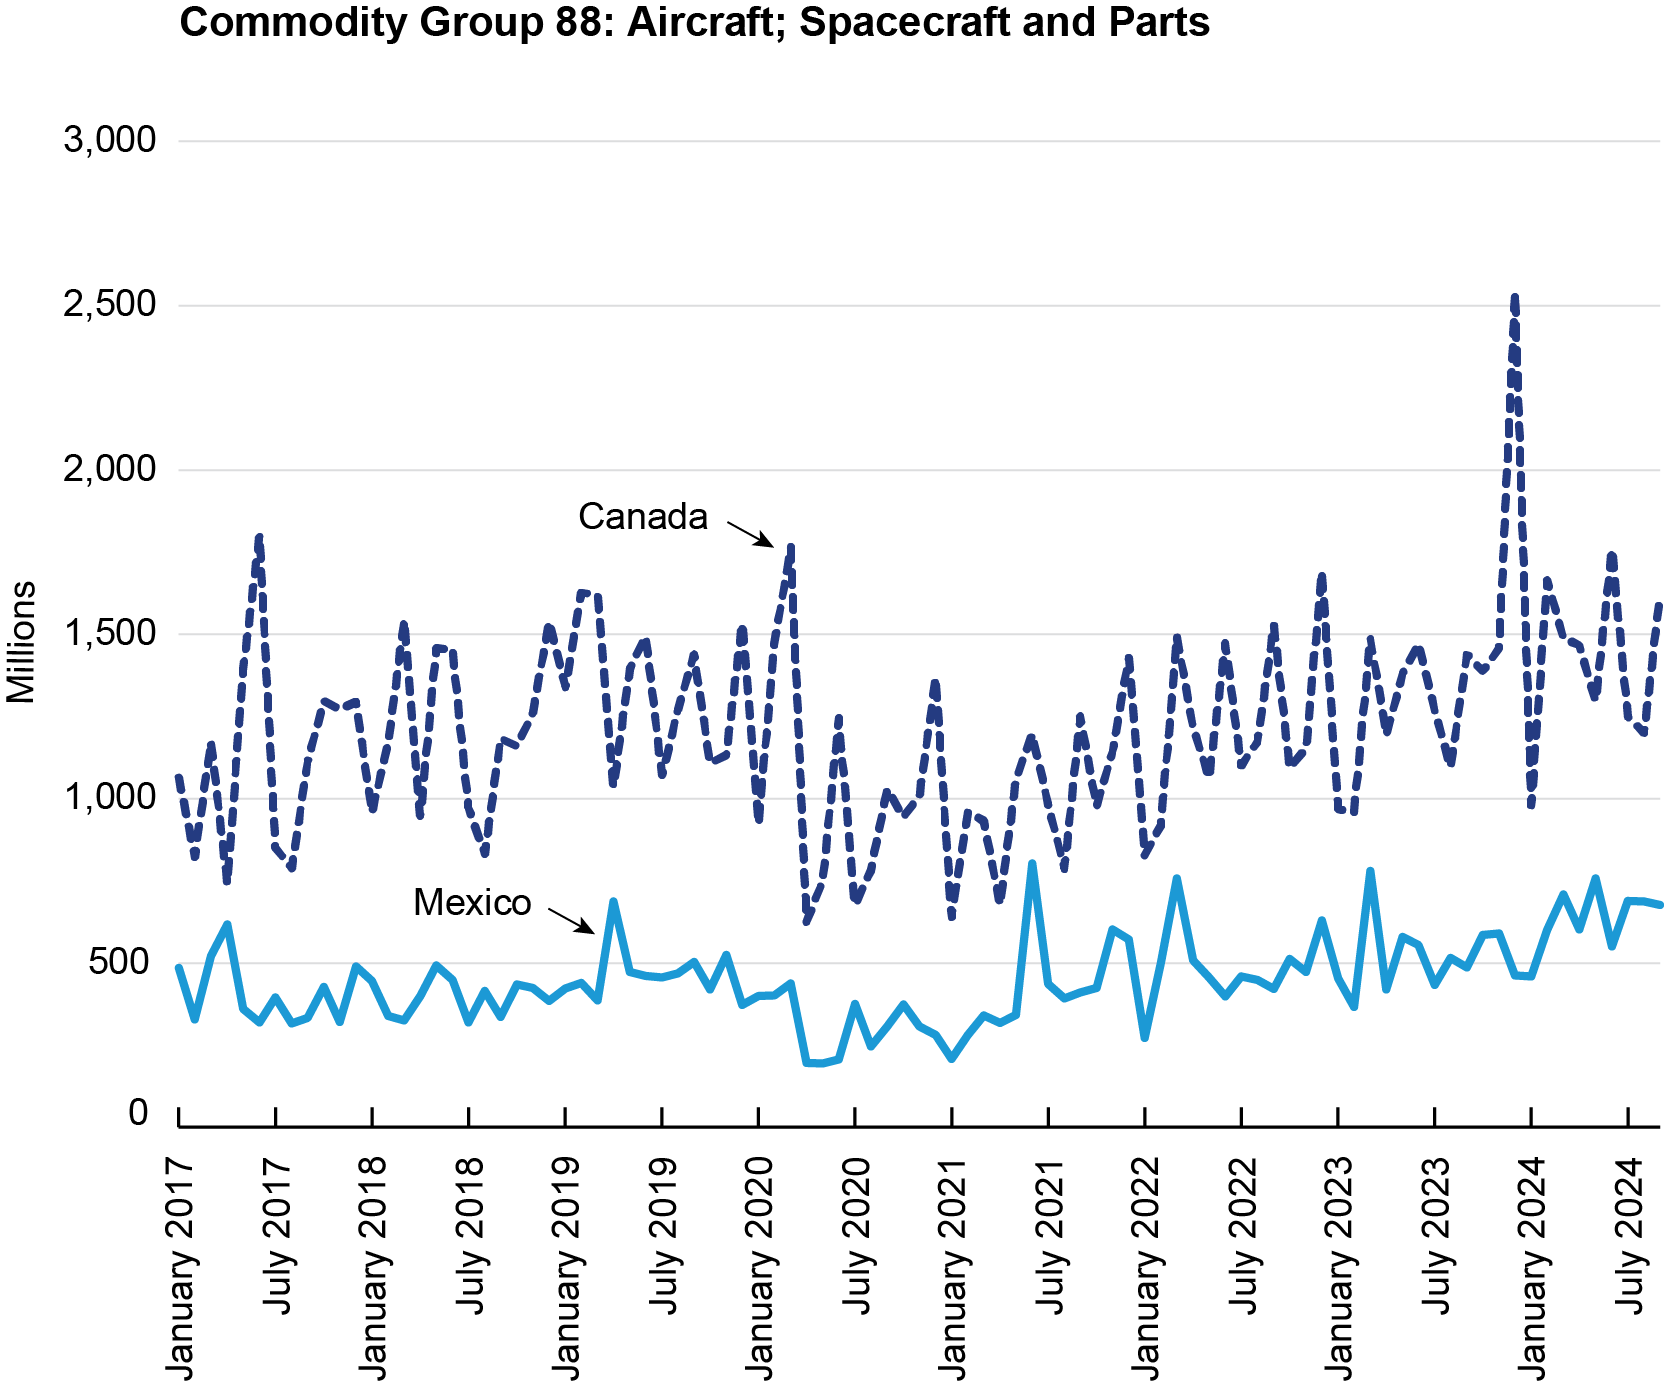
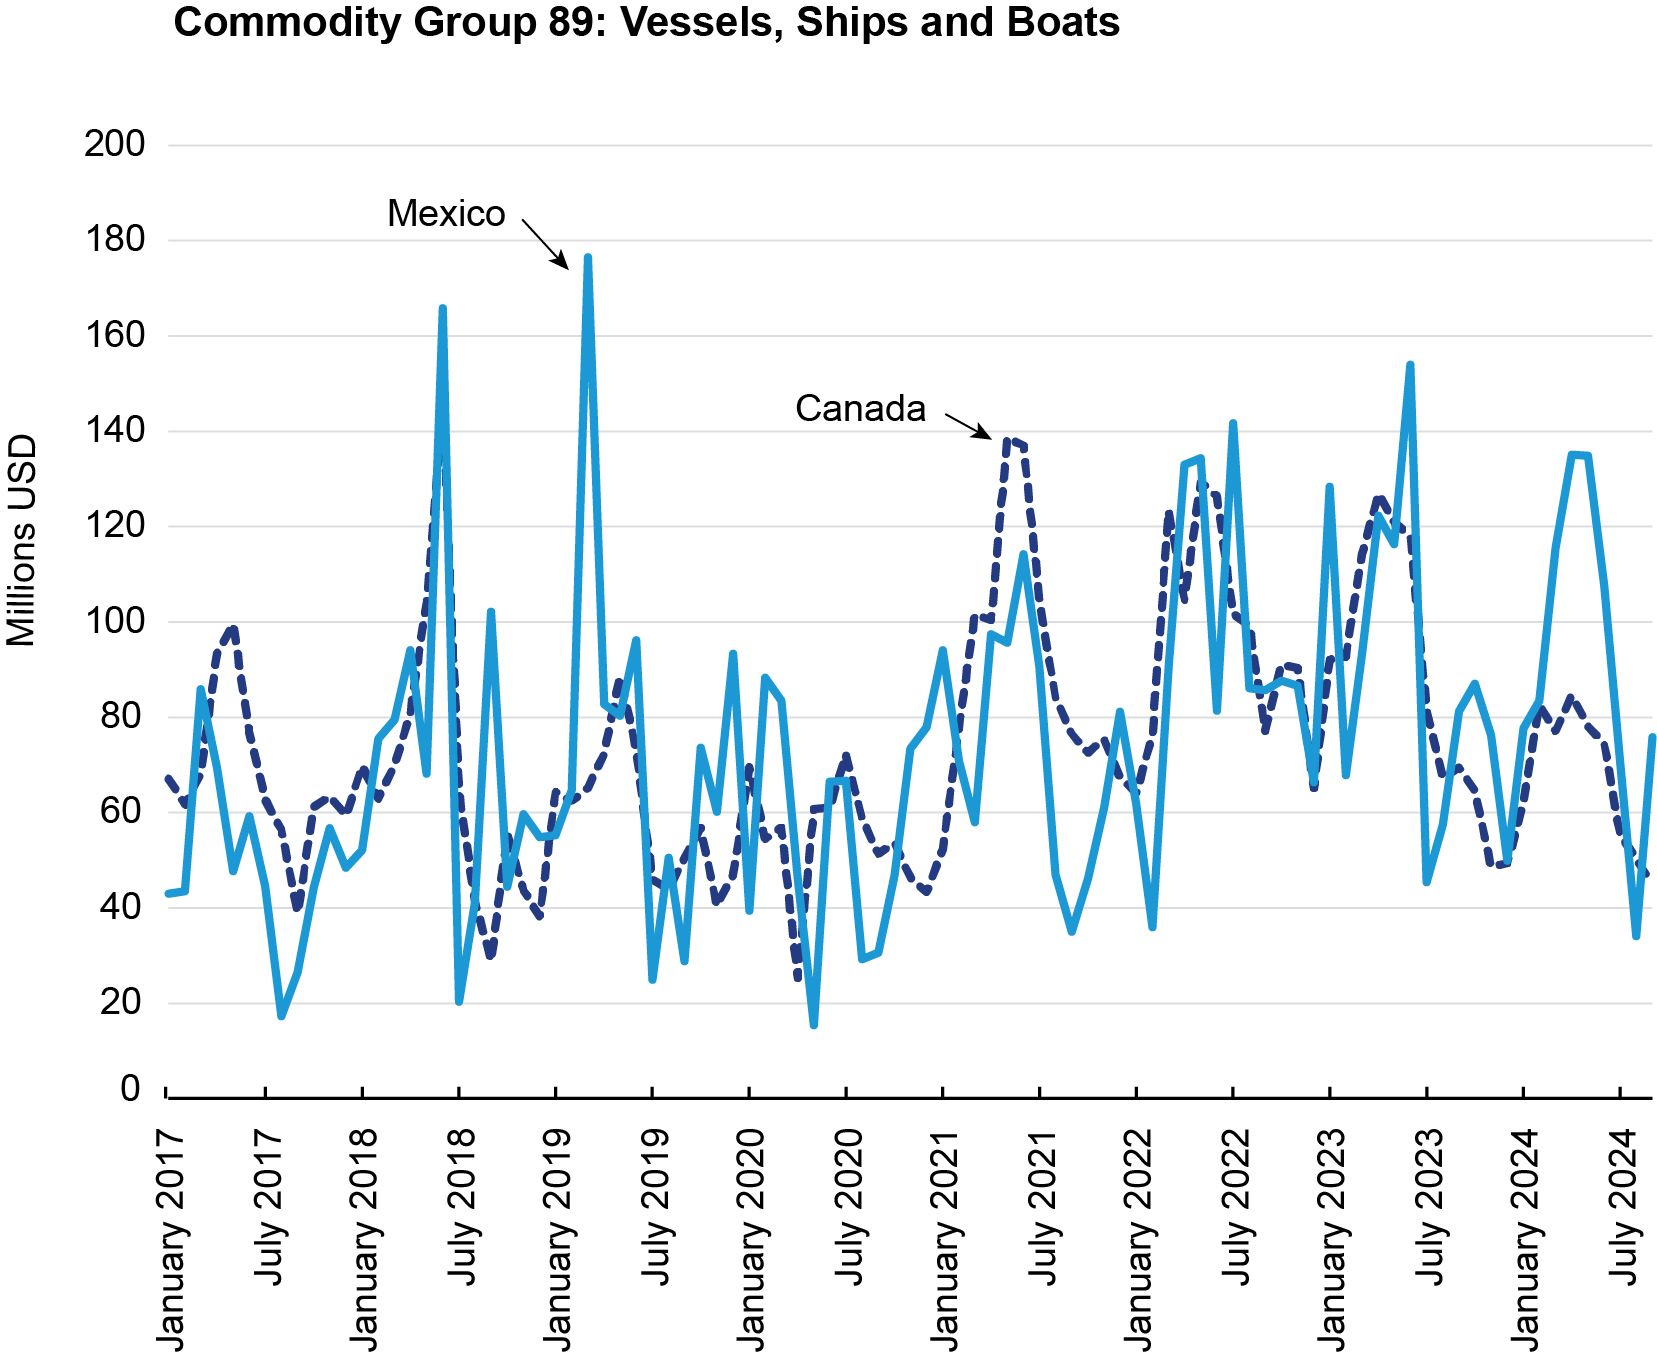
It is important to note, however, that vehicles and parts (87) comprise over 90% of all freight flows within the transportation commodity category.
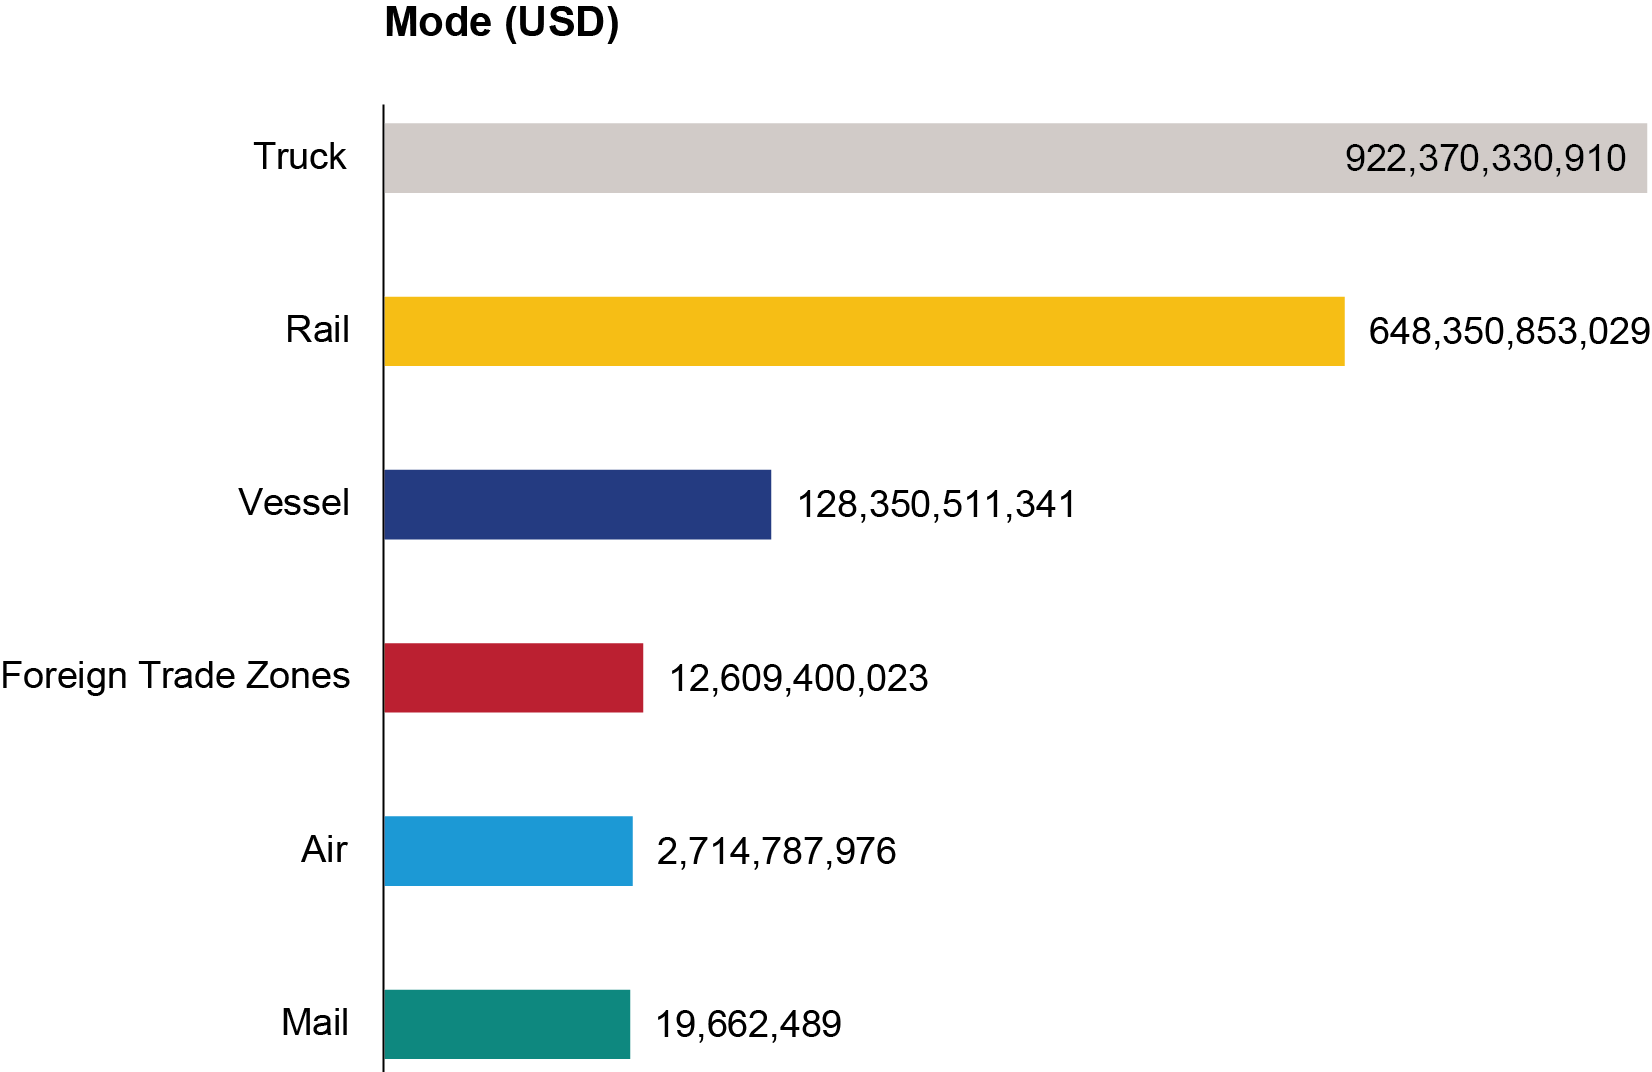
Trucking dominates the movement of freight with Canada and Mexico in commodity group 87 with a total share of 53%, while rail comes in second place with 37.3%, and vessel accounts for 7.4 percent. Foreign Trade Zones account for about 1 percent.
Freight flows with Canada and Mexico in Vehicles and Parts by Mode of Transportation: 2017 - 2014
|
Mode |
Exports % |
Imports % |
Total % |
USD |
|
Truck |
38.6 |
61.4 |
53.0% |
922,370,330,910 |
|
Rail |
26.5 |
73.5 |
37.3% |
648,350,853,029 |
|
Vessel |
6.5 |
93.5 |
7.4% |
128,350,511,341 |
|
Foreign Trade Zones |
0 |
100 |
0.7% |
12,609,400,023 |
|
Air |
63.9 |
36.1 |
0.2% |
2,714,787,976 |
|
|
100 |
0 |
0.0% |
19,662,489 |
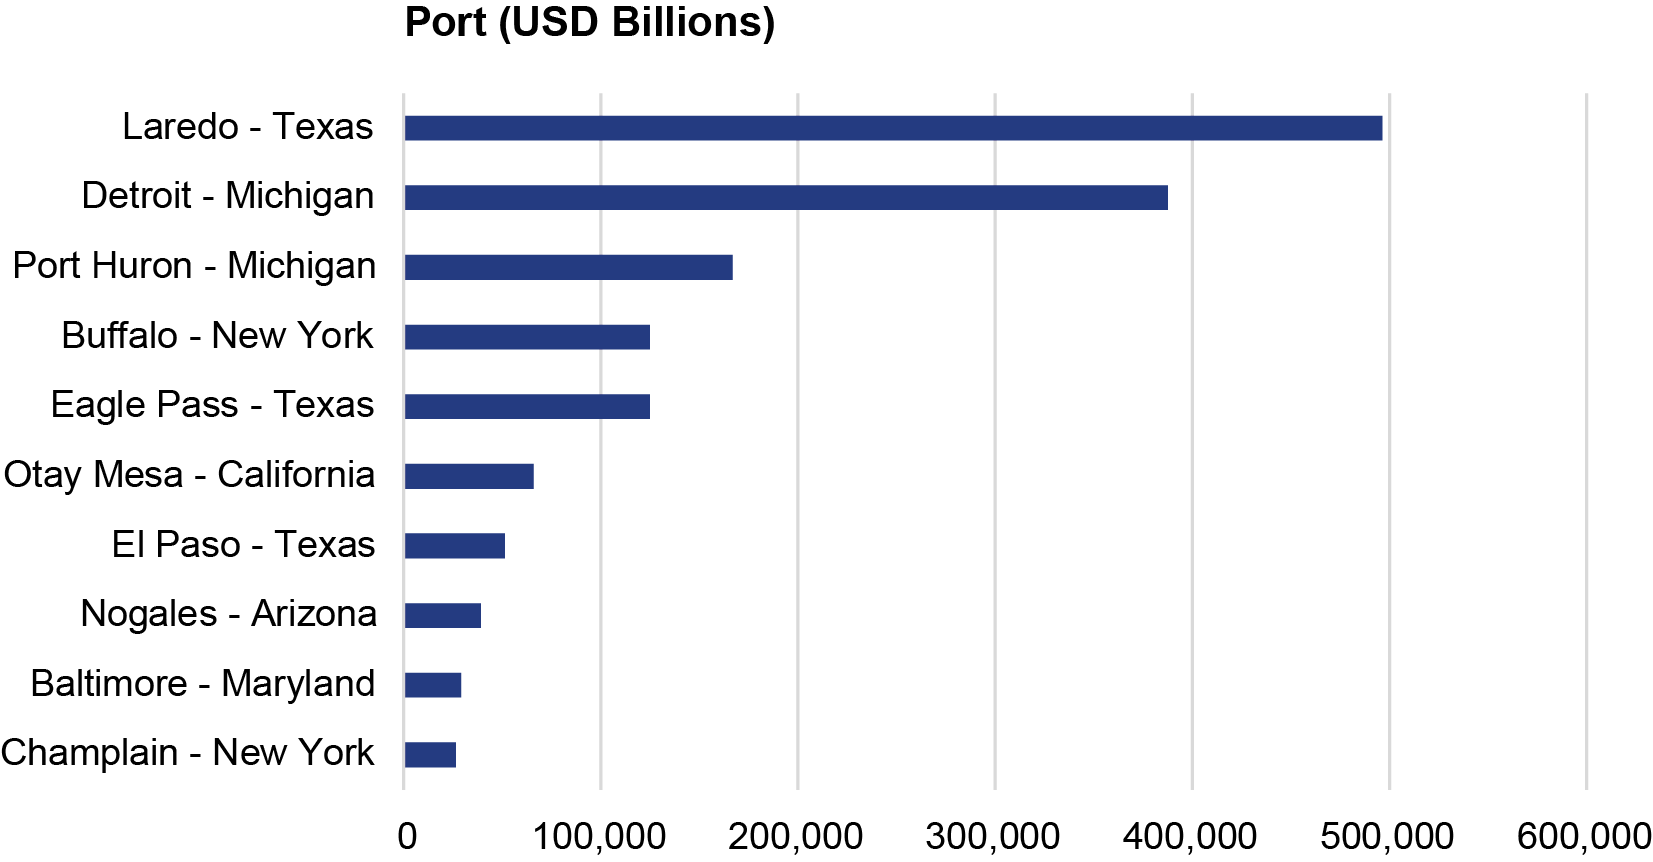
In terms of geography, the land border port of Laredo, Texas led freight flows in transportation commodities with Mexico from 2017 – 2024 with a share of 25.7% for $496.3 billion. Detroit, Michigan took second place with a share of 20.1% or $387.5 billion, followed by Port Huron, Michigan with 8.6% or $166.9 billion.
|
Top 10 Ports |
Export % |
Import % |
Total % |
USD Billions |
|
Laredo - Texas |
24.4 |
75.6 |
25.7% |
496,294 |
|
Detroit - Michigan |
49.1 |
50.9 |
20.1% |
387,530 |
|
Port Huron - Michigan |
38.6 |
61.4 |
8.6% |
166,863 |
|
Buffalo - New York |
48.5 |
51.5 |
6.5% |
124,965 |
|
Eagle Pass - Texas |
11.6 |
88.4 |
6.5% |
124,843 |
|
Otay Mesa - California |
22.1 |
77.9 |
3.4% |
65,862 |
|
El Paso - Texas |
17.8 |
82.2 |
2.7% |
51,161 |
|
Nogales - Arizona |
13.5 |
86.5 |
2.0% |
39,234 |
|
Baltimore - Maryland |
11.2 |
88.8 |
1.5% |
29,002 |
|
Champlain - New York |
54.9 |
45.1 |
1.4% |
26,266 |
Notes: Commodity group 87 is the tariff classification for vehicles that are not railway or tramway rolling stock, as well as their parts and accessories that include:
8701: Tractors
8702: Motor vehicles that transport at least 10 people, including the driver
8703: Motor cars and other motor vehicles that are mainly designed to transport fewer than 10 people, including station wagons and racing cars
8704: Motor vehicles that transport goods, including chassis with an engine and cab
8705: Special purpose motor vehicles, such as breakdown lorries, fire fighting vehicles, and concrete-mixer lorries
Source: Bureau of Transportation Statistics, Transborder Freight Data, adapted from Census Bureau Economic Indicators Division, FT900 U.S. International Trade in Goods and Services, available at https://explore.dot.gov/#/views/Dashboard_PortbyCommodity/PortsbyCommodities
