
Transportation Delivers Harvest from Field and Farm to Family Tables
Data spotlights represent data and statistics from a specific period of time, and do not reflect ongoing data collection. As individual spotlights are static stories, they are not subject to the Bureau of Transportation Statistics (BTS) web standards and may not be updated after their publication date. Please contact BTS to request updated information.
It is customary in November to express thanks for the bounty of the American harvest. That harvest is a major portion of the 3.3 billion tons of agricultural products moved in 2018.
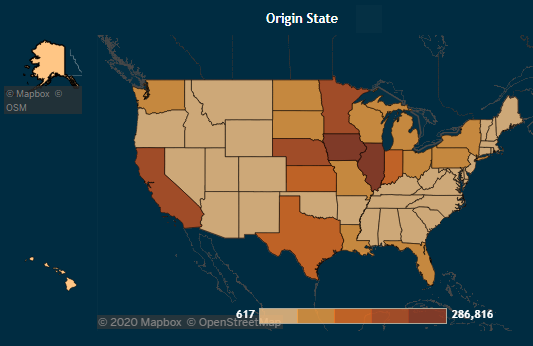
The map above shows the amount of food (in thousands of tons) shipped from each state with darker shading indicating more tonnage. Source: FAF
NOTE: On the BTS Freight Analysis Framework dashboard, you can view freight flows in value and tons within and between states and filter by different commodities.
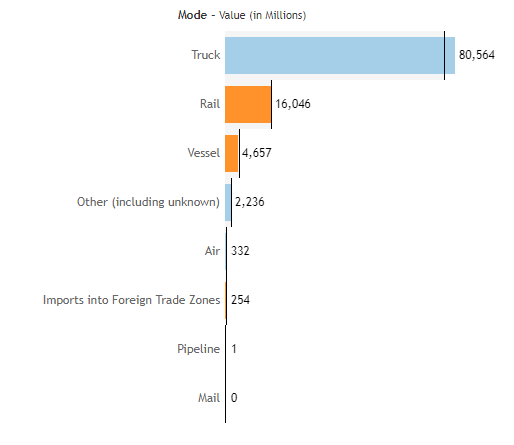
From farm to market, agricultural products move by all forms of transportation, with trucks carrying the greatest share.
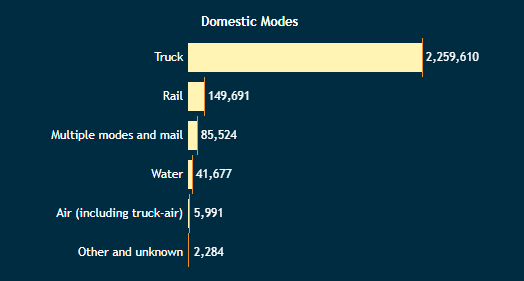
The chart above shows the value of food (in millions of $) transported in the U.S. by commodity and by mode. Source: FAF
There's more to that pie than meets the eye.
A simple pumpkin pie is not just the work of bakers but is the final product of an entire team of agriculture and transportation workers producing and moving pumpkin, wheat, eggs, milk, butter, sugar, and spices.
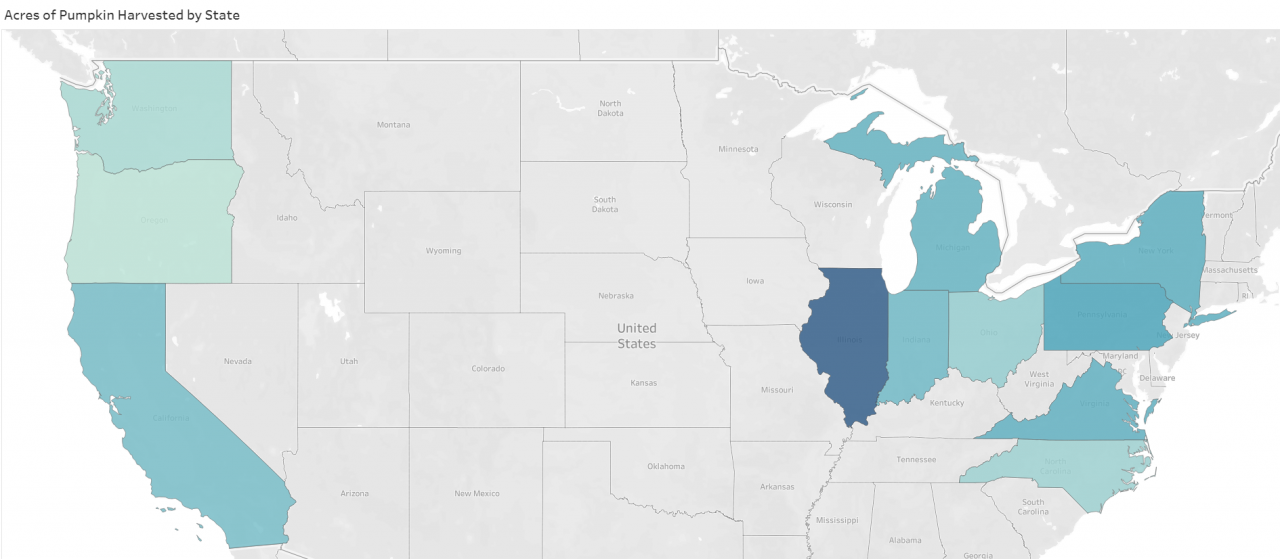
The map above shows the acres of pumpkin harvested in 2019 by reporting States. States shaded darker harvested more acres. Source: NASS
And then, there's the turkey.
This year, the COVID-19 pandemic could mean fewer large, extended-family gatherings; for turkey producers and shippers, that creates the expectation of more gatherings overall but with fewer people attending each. The U.S. Department of Agriculture reports that the price of whole frozen turkeys rose last month by 19% over October 2019. Whole fresh turkey prices also were up 14% year-over-year. When the U.S. isn't feasting on toms and hens, the nation remains the world’s largest exporter of frozen turkeys.
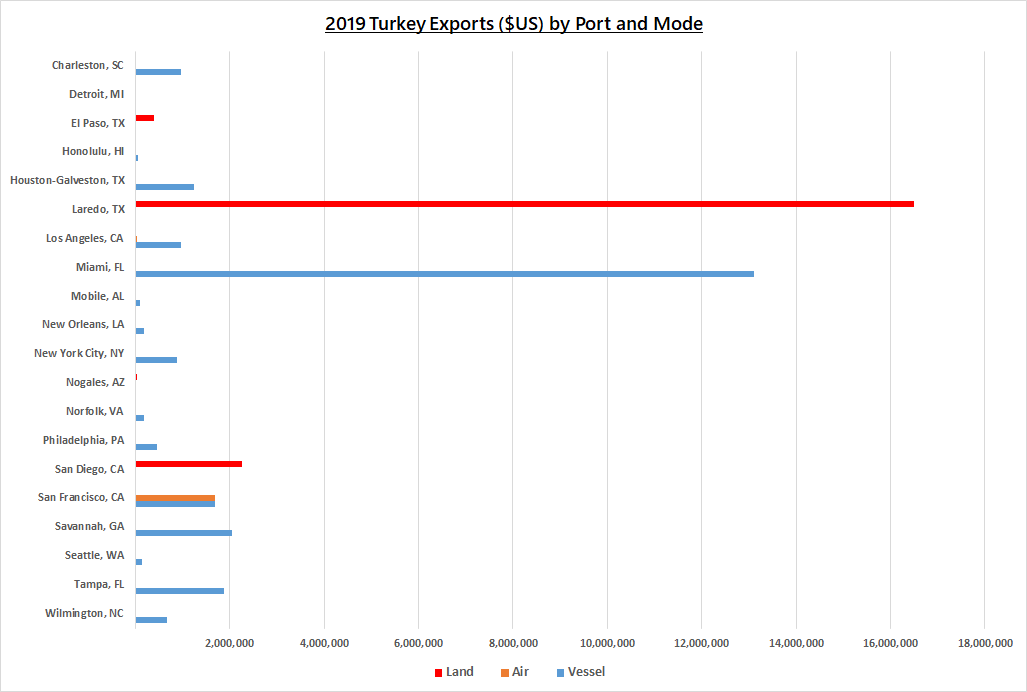
The chart above shows U.S. exports of frozen whole turkeys by port of departure and mode of transportation. Source: Census
US exports of frozen turkeys largely cross the border at land ports (bars shown in red in the chart above) in Texas, Arizona, and California; they are exported by water primarily through Florida, California, Georgia, Texas, and the Carolinas; and a lot of turkeys are flown from San Francisco. As the concentration of road- and rail-riding turkey exports on our southern border suggests, Mexico is the leading foreign consumer of American turkeys.
The chart above shows the value of North American trade of food commodities by mode of transportation in 2019. Source: BTS Transborder
Whatever foods you enjoy at your table, and whomever you share your table with, BTS wishes you a safe harvest season.