
Trends in bus and bus passenger border crossings: 2019 – 2025
Data spotlights represent data and statistics from a specific period of time, and do not reflect ongoing data collection. As individual spotlights are static stories, they are not subject to the Bureau of Transportation Statistics (BTS) web standards and may not be updated after their publication date. Please contact BTS to request updated information.
The Border Crossing data program provide monthly and annual statistics for trucks, trains, containers, buses, personal vehicles, passengers, and pedestrians entering the U.S. at land ports of entry.
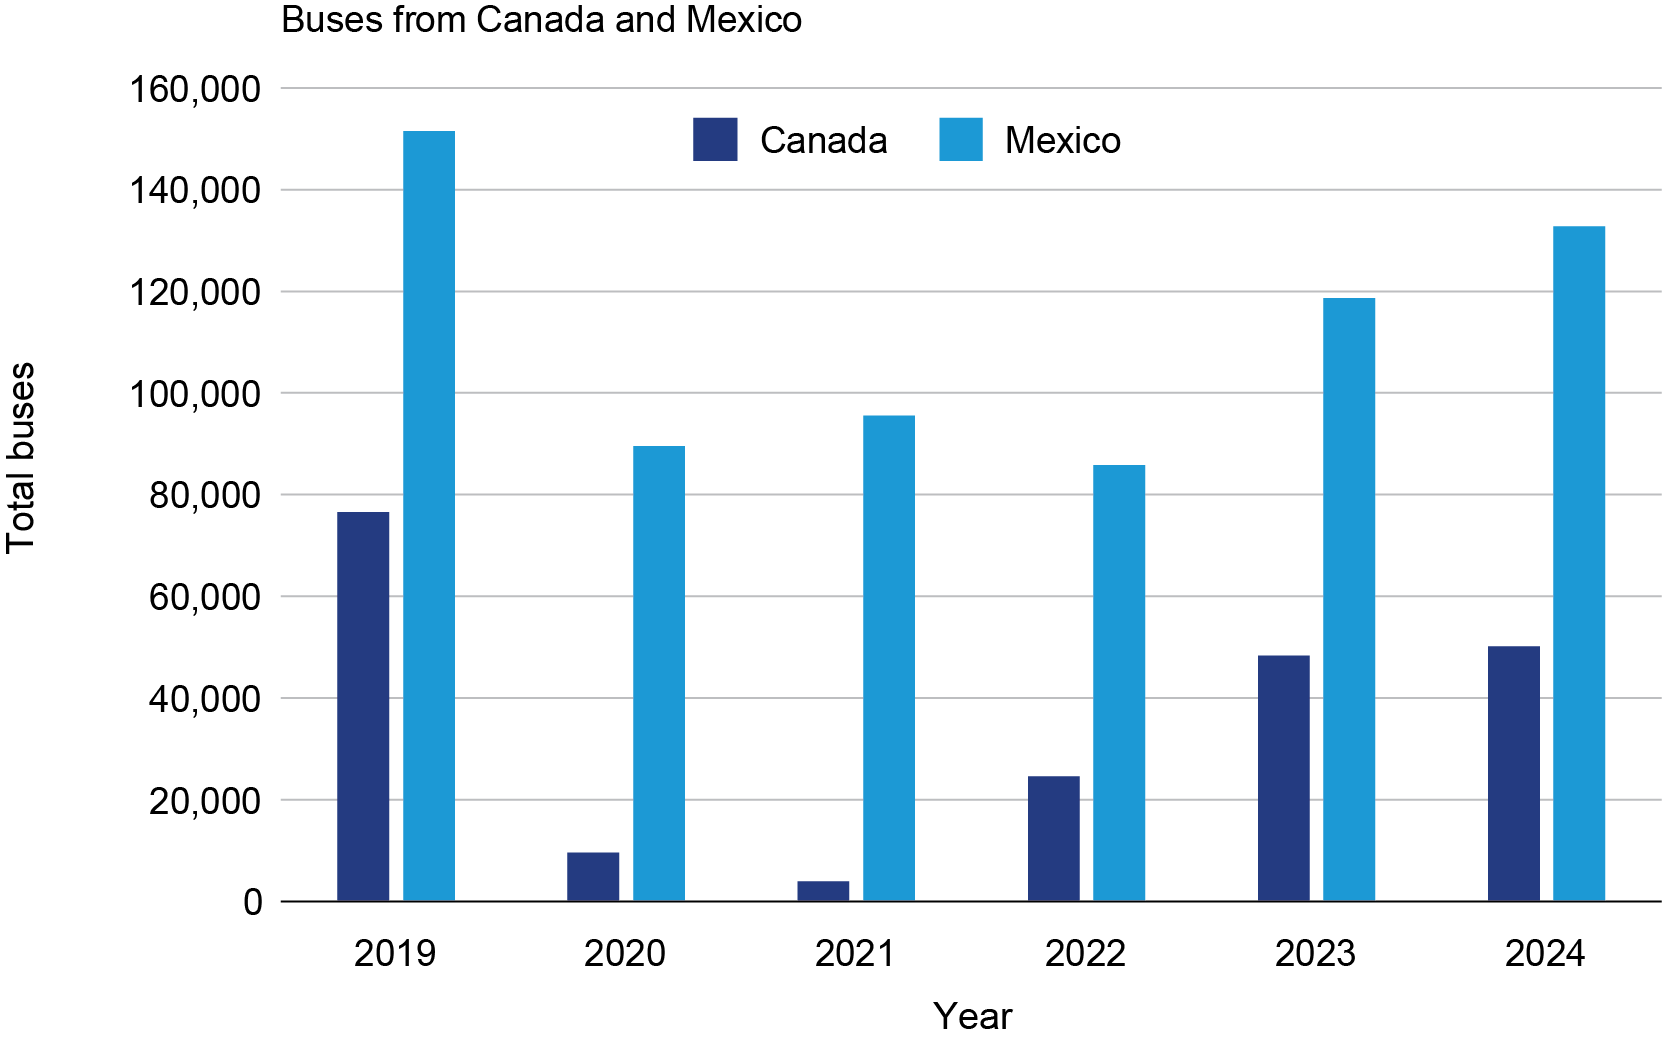
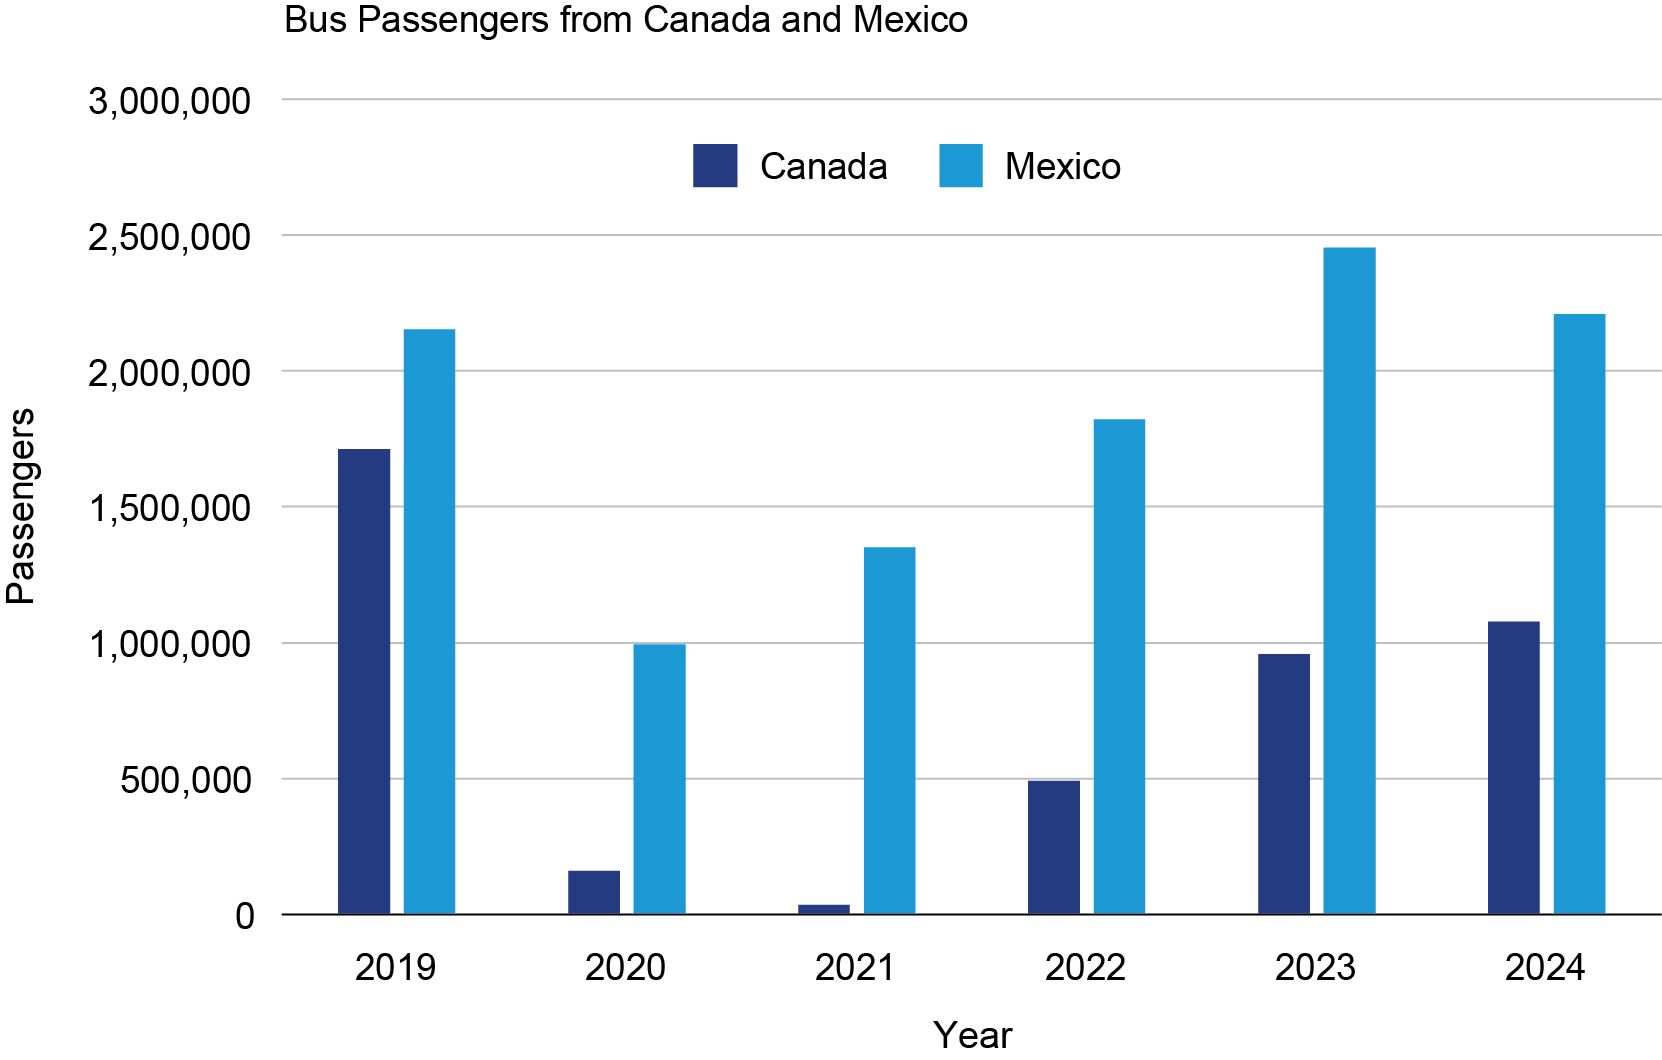
From 2019 to 2024, the number of incoming persons crossing by all modes of transportation declined 13.5% from Canada and 0.7% from Mexico. In the same period, the number of buses from both Canada and Mexico decreased, 34.5% and 12.4% respectively. The number of bus passengers from Canada declined 37.0% while increasing 2.6% from Mexico.
Persons Crossing Border by All Modes of Transportation
| 2019 | 2020 | 2021 | 2022 | 2023 | 2024 | |
| Canada | 86,210,714 | 21,794,916 | 16,534,787 | 47,420,136 | 68,242,226 | 74,586,656 |
| Mexico | 267,917,652 | 163,659,469 | 191,466,709 | 246,783,959 | 260,186,248 | 266,022,112 |
Bus Crossings
| 2019 | 2020 | 2021 | 2022 | 2023 | 2024 | |
| Canada | 76,529 | 9,604 | 4,042 | 24,636 | 48,334 | 50,129 |
| Mexico | 151,541 | 89,518 | 95,605 | 85,766 | 118,719 | 132,747 |
Bus Passenger Crossings
| 2019 | 2020 | 2021 | 2022 | 2023 | 2024 | |
| Canada | 1,713,110 | 160,990 | 35,469 | 492,087 | 958,245 | 1,078,984 |
| Mexico | 2,153,331 | 992,386 | 1,349,868 | 1,821,698 | 2,453,822 | 2,209,982 |
Bus passengers per bus
| 2019 | 2020 | 2021 | 2022 | 2023 | 2024 | |
| Canada | 22.4 | 16.8 | 8.8 | 20 | 19.8 | 21.5 |
| Mexico | 14.2 | 11.1 | 14.1 | 21.2 | 20.7 | 16.6 |
Note: The data reflect the number of inbound crossings through CBP facilities. Users seeking more detailed data such as outbound counts may want to review information from individual bridge operators, Metropolitan Planning Organizations, and border state governments.
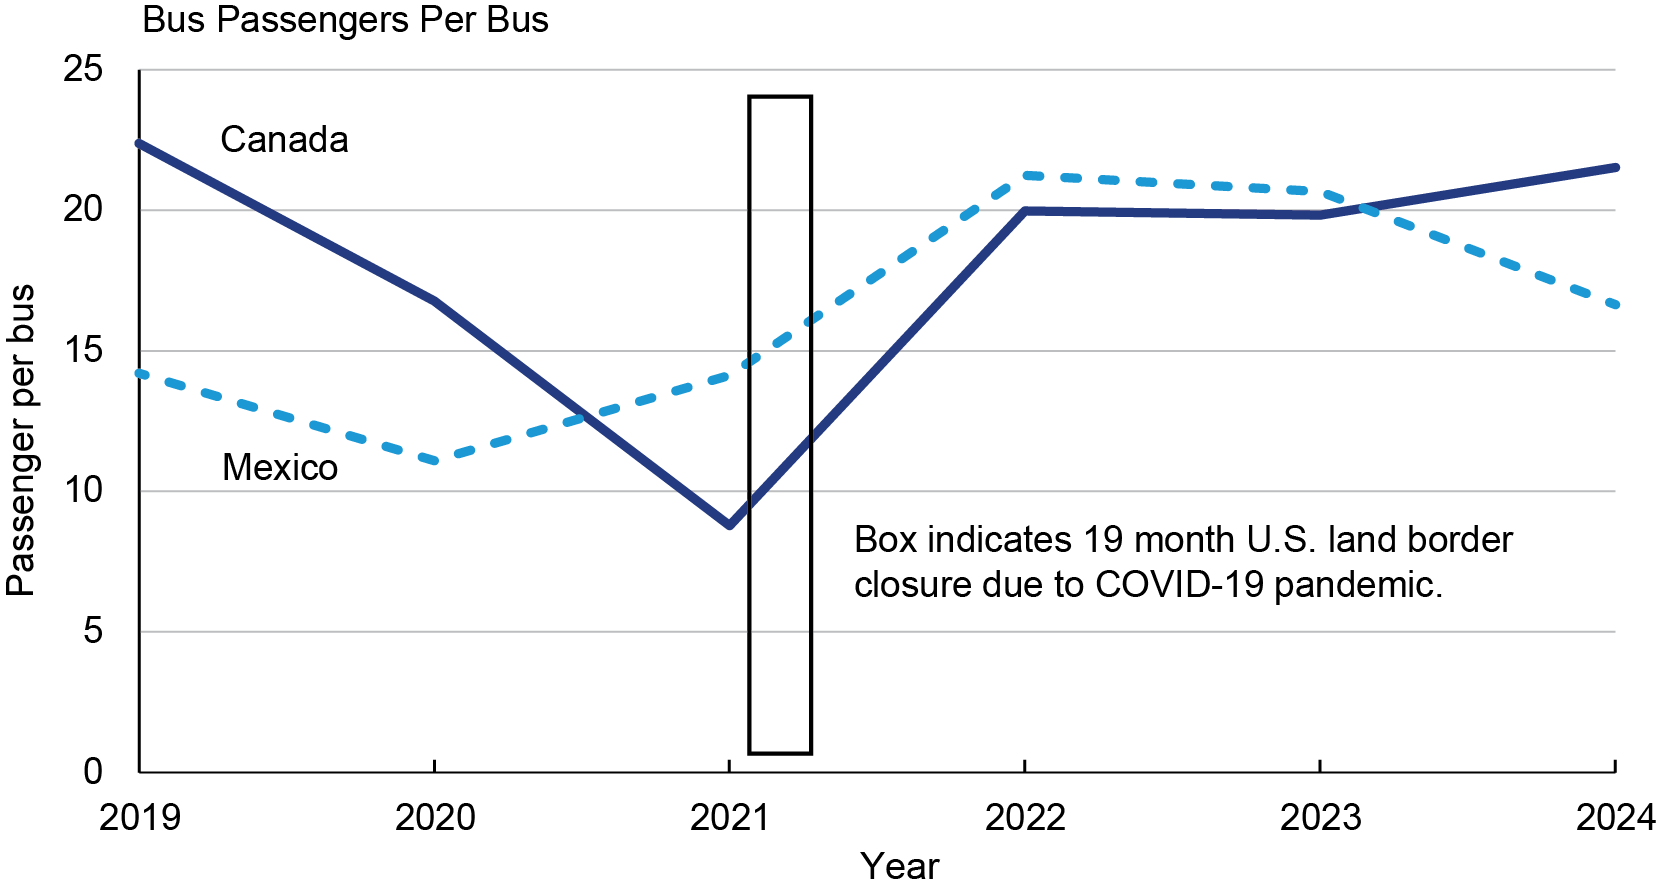
The U.S. - Canada border was closed to all non-essential travel in 2020 and re-opened in both directions to all travel after 19 months. Since then, the number of bus passengers per bus from Canada has increased sharply at 145.3% while increasing 17.9% from Mexico.
Comparing available data for January through April 2025, the number of bus passengers has declined at the top 5 border crossing ports of entry along the Northern border exception Blaine, Washington, which increased 35.9 percent. Bus passenger counts along the Southern border are more evenly distributed, with Eagle Pass, Texas numbers increasing 38% in April 2025 over April 2024.
Canada Bus Passengers: Top 5 Ports
| 2024-2025 % Change | ||||
| January | February | March | April | |
| Champlain Rouses Point, NY | -14.5 | 13.9 | -23.9 | -17.6 |
| Buffalo Niagara Falls, NY | 34.4 | 0.6 | -9.7 | -20 |
| Blaine, WA | 291.2 | 244.1 | 106.5 | 35.9 |
| Detroit, MI | 0.5 | -10 | -42 | -41.9 |
| Highgate Springs, NY | 24.1 | 23 | -15.8 | -18.1 |
Mexico Bus Passengers: Top 5 Ports
| 2024-2025 % Change | ||||
| January | February | March | April | |
| Laredo, TX | 12 | -1 | -6 | -7 |
| San Ysidro, CA | 3 | 2 | -20 | -9 |
| Nogales, AZ | 22 | 6 | -3 | 20 |
| Eagle Pass, TX | -34 | 0 | -32 | 38 |
| Hidalgo, TX | 7 | -18 | -19 | -16 |
Source: Bureau of Transportation Statistics, Border Crossing Data, available at https://data.bts.gov/stories/s/jswi-2e7b
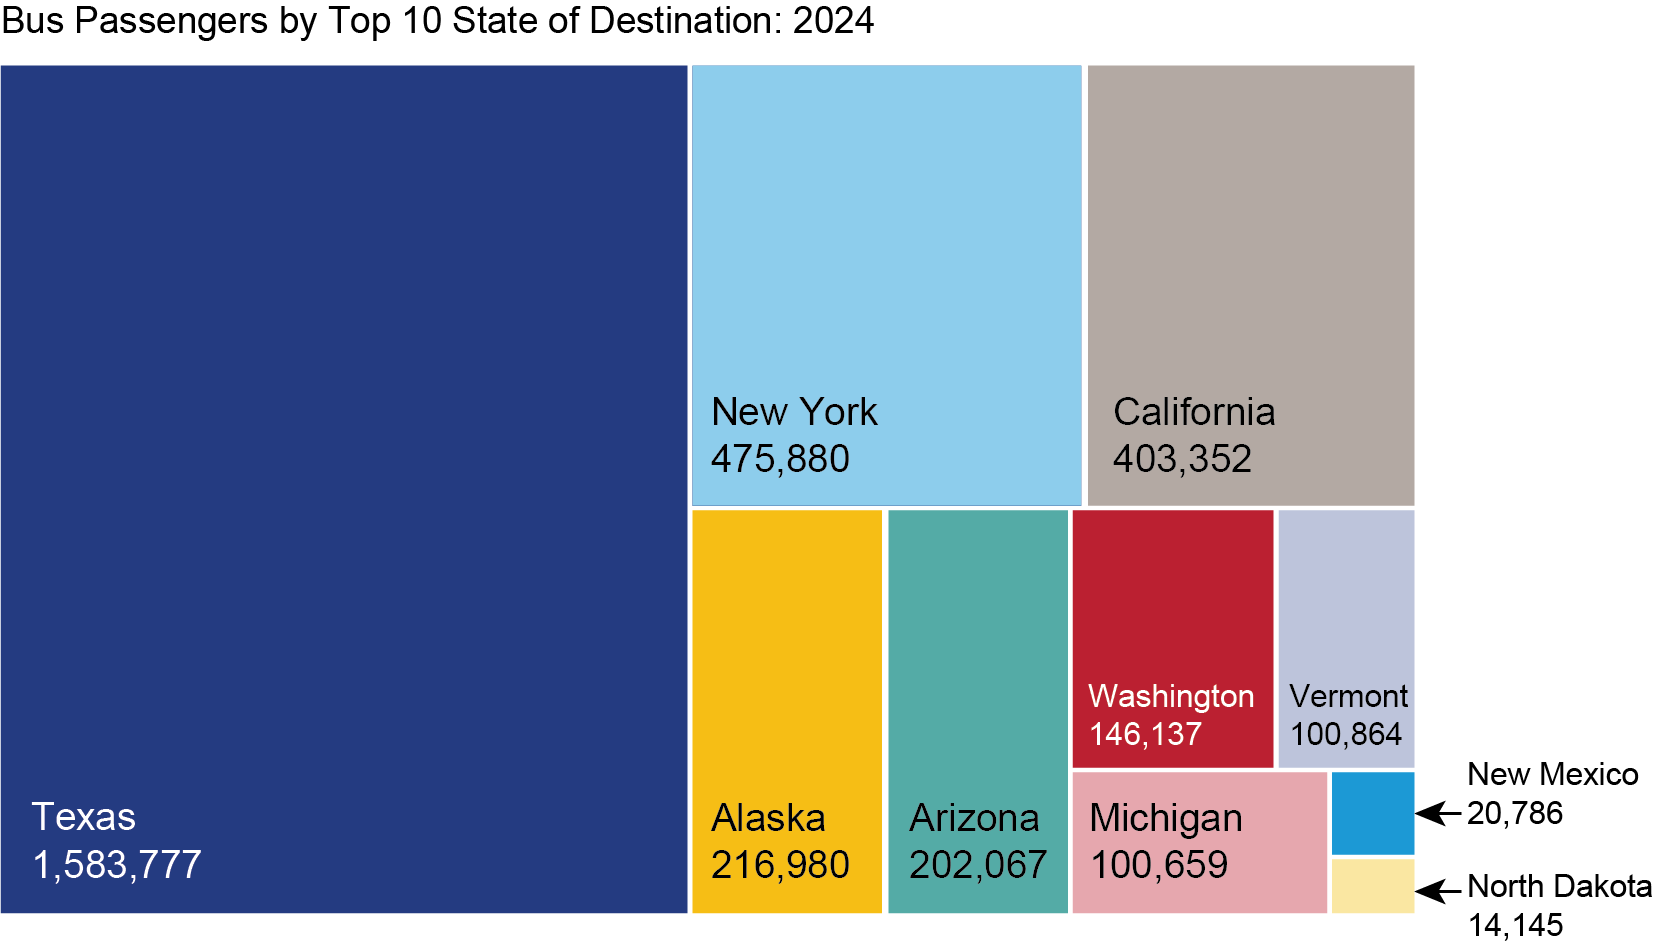
The ports in Texas and California handled the largest share of incoming buses from Mexico while New York and Alaska took second and fourth place for buses from Canada.
View full database here. View Frequently Asked Questions. View Coverage, Availability, Definitions and Notes. For the CBP Port Locator tool, click here. For border wait time data, click here. For CBP Title 8 Apprehensions, Title 8 Inadmissible, and Title 42 Expulsions, click here. For additional CBP datasets, please see the CBP Public Data Portal by visiting this link.
To receive updates from BTS directly to your email, please consider subscribing to our GovDelivery service.