
U.S. Ports Work Through Daunting Challenges to Deliver the Goods
Data spotlights represent data and statistics from a specific period of time, and do not reflect ongoing data collection. As individual spotlights are static stories, they are not subject to the Bureau of Transportation Statistics (BTS) web standards and may not be updated after their publication date. Please contact BTS to request updated information.
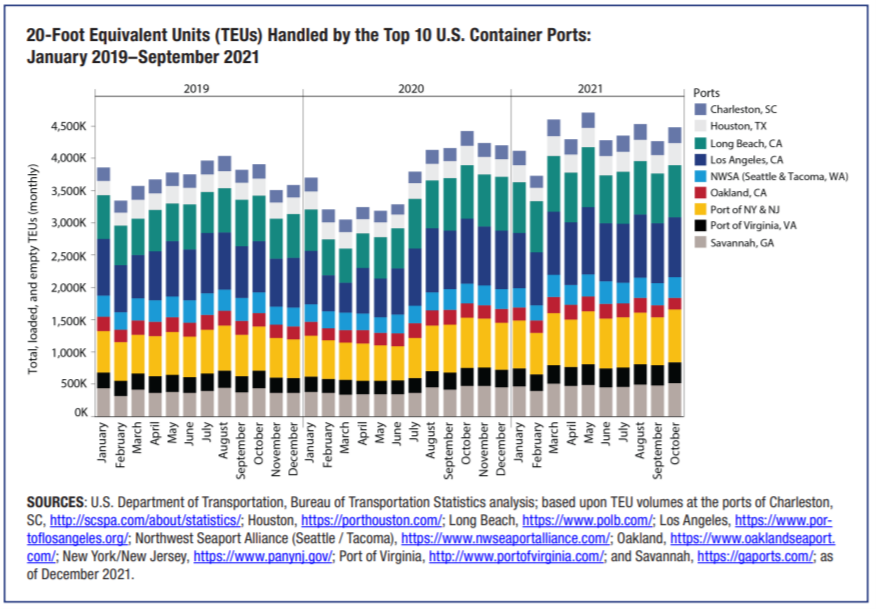
With a perfect storm of existing capacity limits, rapid demand increases, and the labor shortages from initial COVID-19 pandemic reductions, container ports are facing major challenges in moving cargo. As the chart below shows, since late 2020, U.S. container ports have been successfully bringing in goods at a much stronger pace than before the pandemic.
In our just-in-time shipping model, ports operate close to capacity.
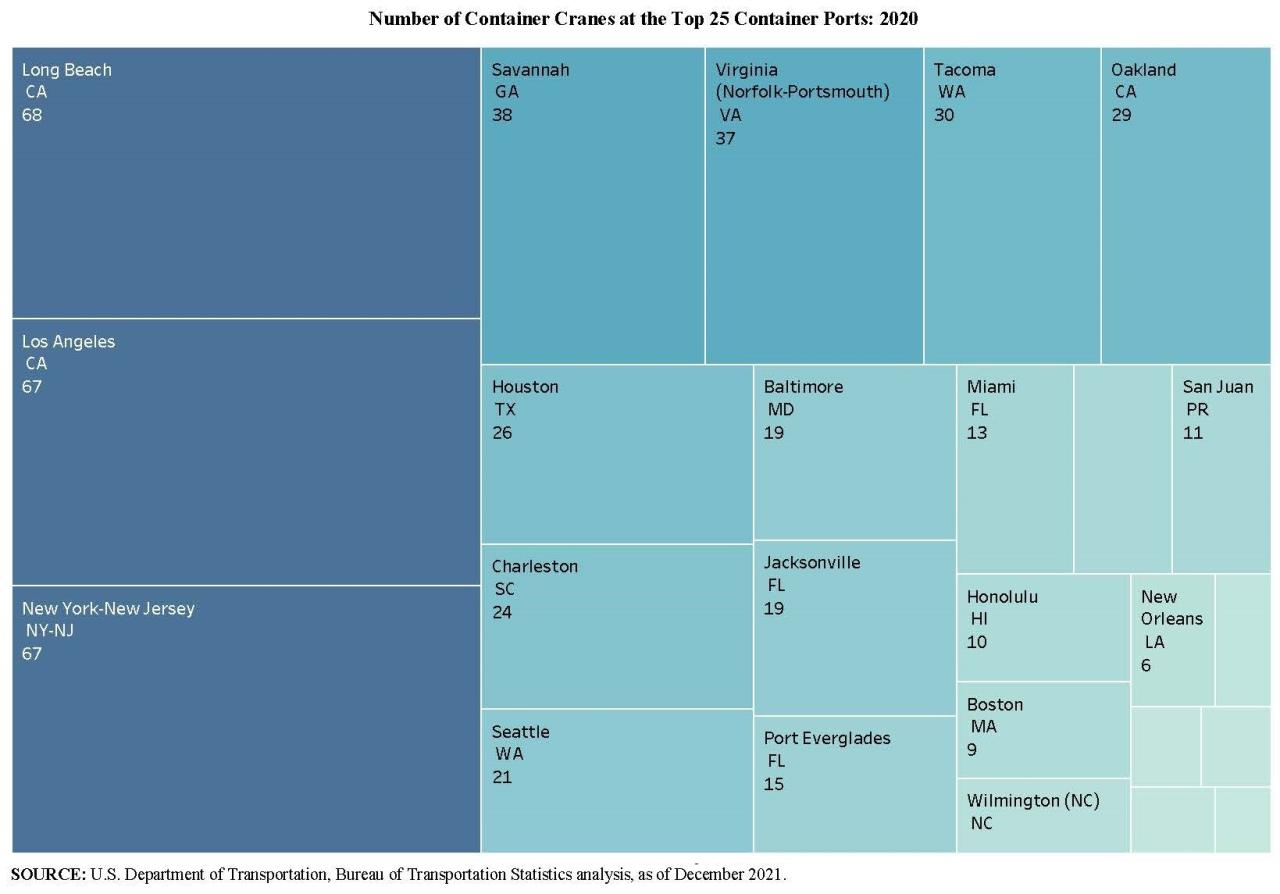
Under normal conditions, our port facilities have capacity limits, determined in part by the size (acreage) of terminals, length of berths, depth of access channels, and the amount and type of cargo handling equipment (e.g., container cranes). Excess capacity means idle resources, and ports are less likely to invest in greater capacity before market indicators signal the need to expand. The chart below indicates relative container crane capacities of 25 top US ports.
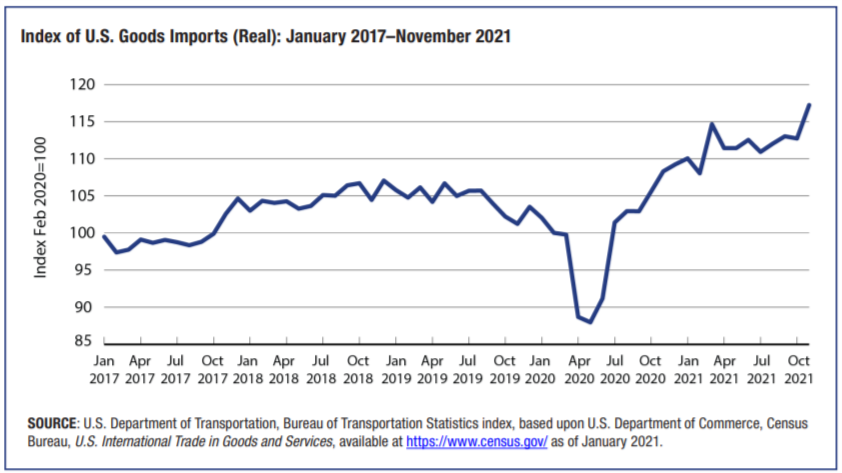
Demand for goods bounced back and quickly exceeded pre-pandemic levels.
With COVID-19, demand for goods plummeted shortly after the pandemic’s onset in March 2020, then quickly surpassed pre-pandemic levels. As the chart below shows, demand growth during the pandemic was atypically swift, if not unprecedented, beginning in the latter half of 2020.
Where do we go from here?
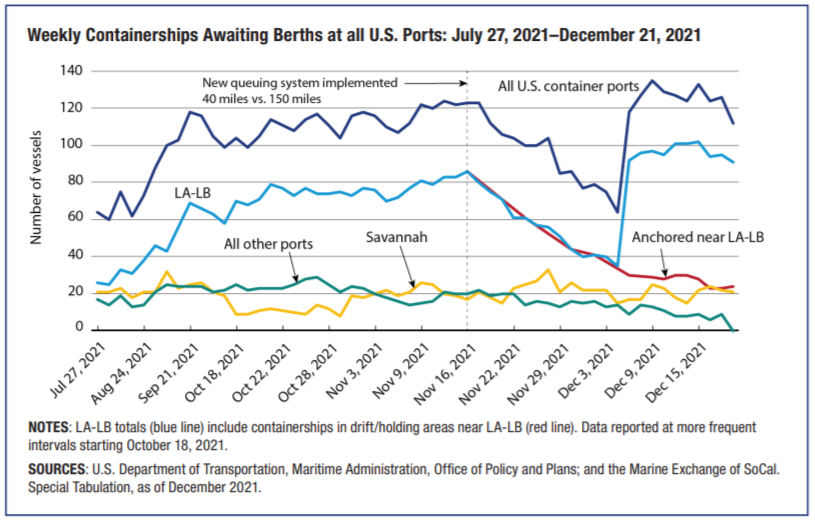
Although the backlog of ships at anchor outside of the ports of Long Beach and Los Angeles has not disappeared, by the end of November 2021, it had started to approach a normal level. Following a brief spike in December, the backlog again began trending downward partially thanks to a new queuing system to manage the backlog. BTS will continue monitoring changes in port capacity, transportation employment, and consumer demand to gauge their effect on port activity.
Learn more about U.S. port capacity and throughput and vessel dwell times with our Port Performance Freight Statistics pages.