U.S. Trade and the Impact of Low Water Levels in Gatun Lake and the Panama Canal
Data spotlights represent data and statistics from a specific period of time, and do not reflect ongoing data collection. As individual spotlights are static stories, they are not subject to the Bureau of Transportation Statistics (BTS) web standards and may not be updated after their publication date. Please contact BTS to request updated information.
The Panama Canal is a key component of the U.S. freight transportation system. For 2023, the Panama Canal Authority reported that U.S. east coast ports exported 125.6 million long tons1 of cargo via the Panama Canal, with 64 percent destined for Asia, while importing 61.1 million long tons of cargo, with 68 percent originating from Asia.2
Along the Gulf Coast, $8.9 billion worth of ag products3 were exported from the Ports of New Orleans and Baton Rouge to Asia in 2023.4 In addition, U.S. west coast ports exported:
- 3 million long tons of cargo via the Panama Canal, with 76 percent slated for Europe, while importing
- 6.4 million long tons of cargo, with 49 percent originating in Europe,
- Imports including $10.3 billion worth of motorized vehicles that were imported from Europe via water to California, Oregon, and Washington in 2023.5
Inter-U.S. ports trade was also facilitated by the Panama Canal with 3.7 million long tons of cargo transiting from east coast to west coast ports and 0.5 million long tons of cargo traveling from west coast to east coast ports.6 The capacity of the Panama Canal to serve this demand depends in part on the availability of local water to supply its locks and channels.
In 2023, Gatun Lake (the larger of two lakes servicing the Panama Canal locks) experienced water levels below seasonal norms due to insufficient rain during the year. The lowered water levels can be seen in Figure 1. For reference, the location of the Panama Canal is shown in Figure 2.
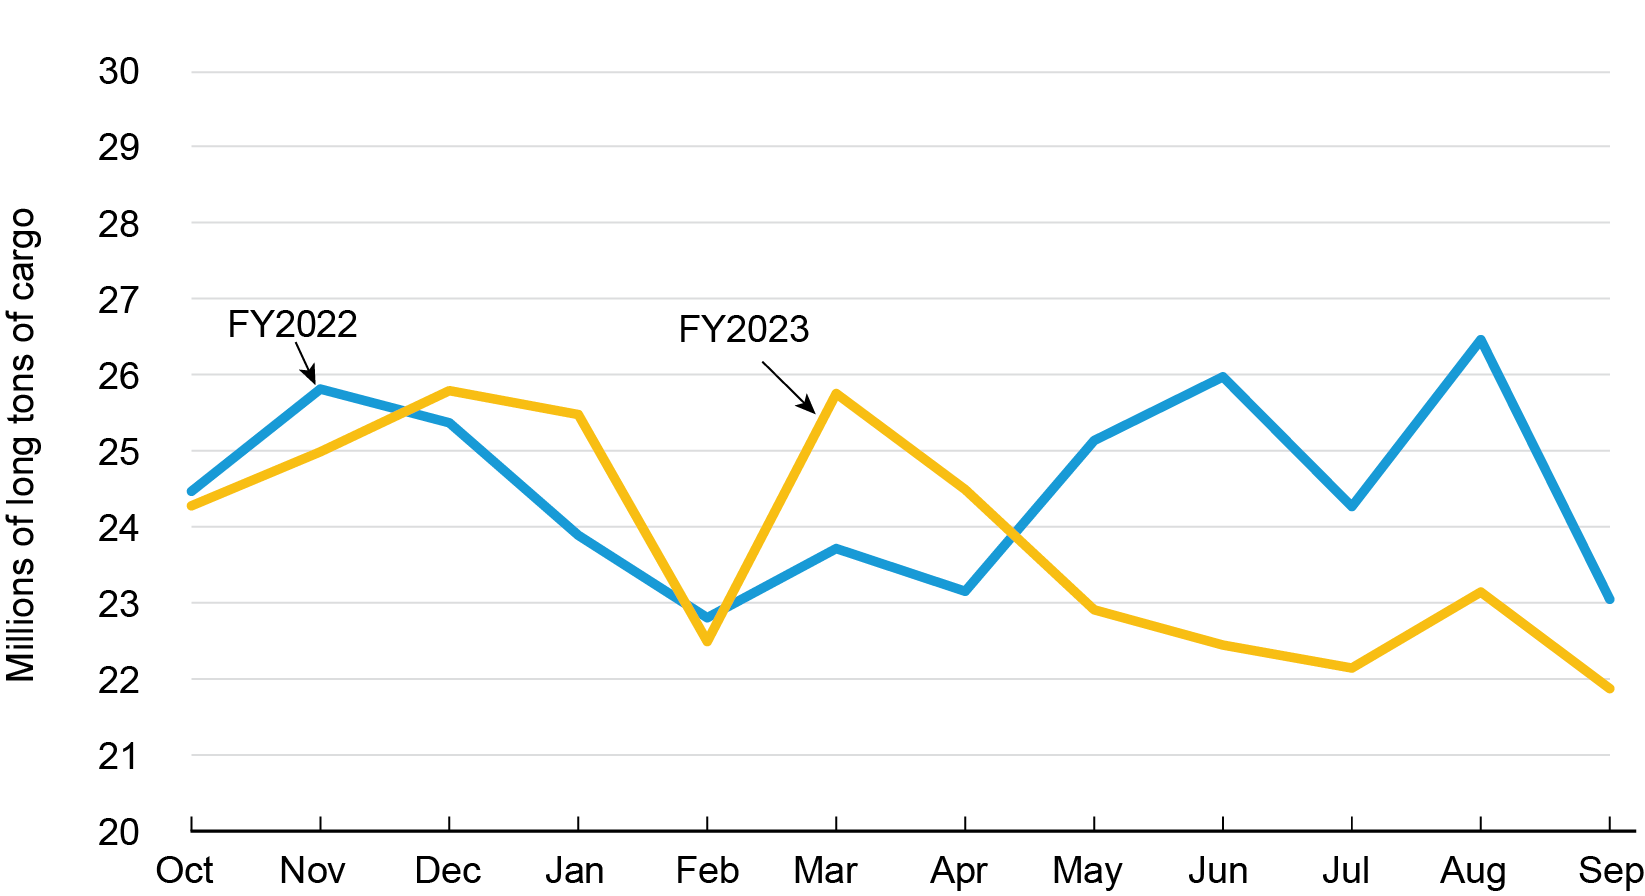
Gatun Lake water levels hovered close to 80 feet between June and November of 2023, while more typically, the rainy season ends in November with levels in the lake at about 88 feet.7 In addition, the Panama Canal Authority has projected water levels to remain below 81 feet at least through March 2024, the latest time period they are currently predicting.8 As a result of the lower water levels in the lake, the Panama Canal Authority has had to restrict ship transits and draft. For example, container vessels would normally draft 50 feet, but since the past summer, they have been restricted to 44 feet. Drafting less means the locks can operate with lower water levels, therefore reducing Gatun Lake water consumption.9 Disruptions to the throughput at the Panama Canal correspond to the low water levels. Compared to FY2022, the monthly number of transits decreased and the tons of cargo per transit decreased, resulting in an overall decrease in the monthly tons of cargo transported through the Panama Canal, as shown in Figures 3 and 4, respectively. There was 10% less cargo moved through the Panama Canal in the last quarter of FY2022, when the lower water level was very pronounced, as compared to FY2023.
Further restrictions on the number of transits through the 2023–2024 winter have also been announced, and per the Authority’s Advisory to Shipping No. A-50-2023, dated Nov. 24, 202310: “While the current water deficit persists in the Canal watershed, the Transit Reservation system is the only mechanism available to guarantee a transit date. Therefore, vessels without a reservation may experience indefinite delays.” More information can be found about this developing situation on the Authority’s website.11
Figure 1: Gatun Lake Reservoir Water Level (ft), January 1, 2021 – January 24, 2024, with Projected Water Levels January 25, 2024 – March 25, 2024
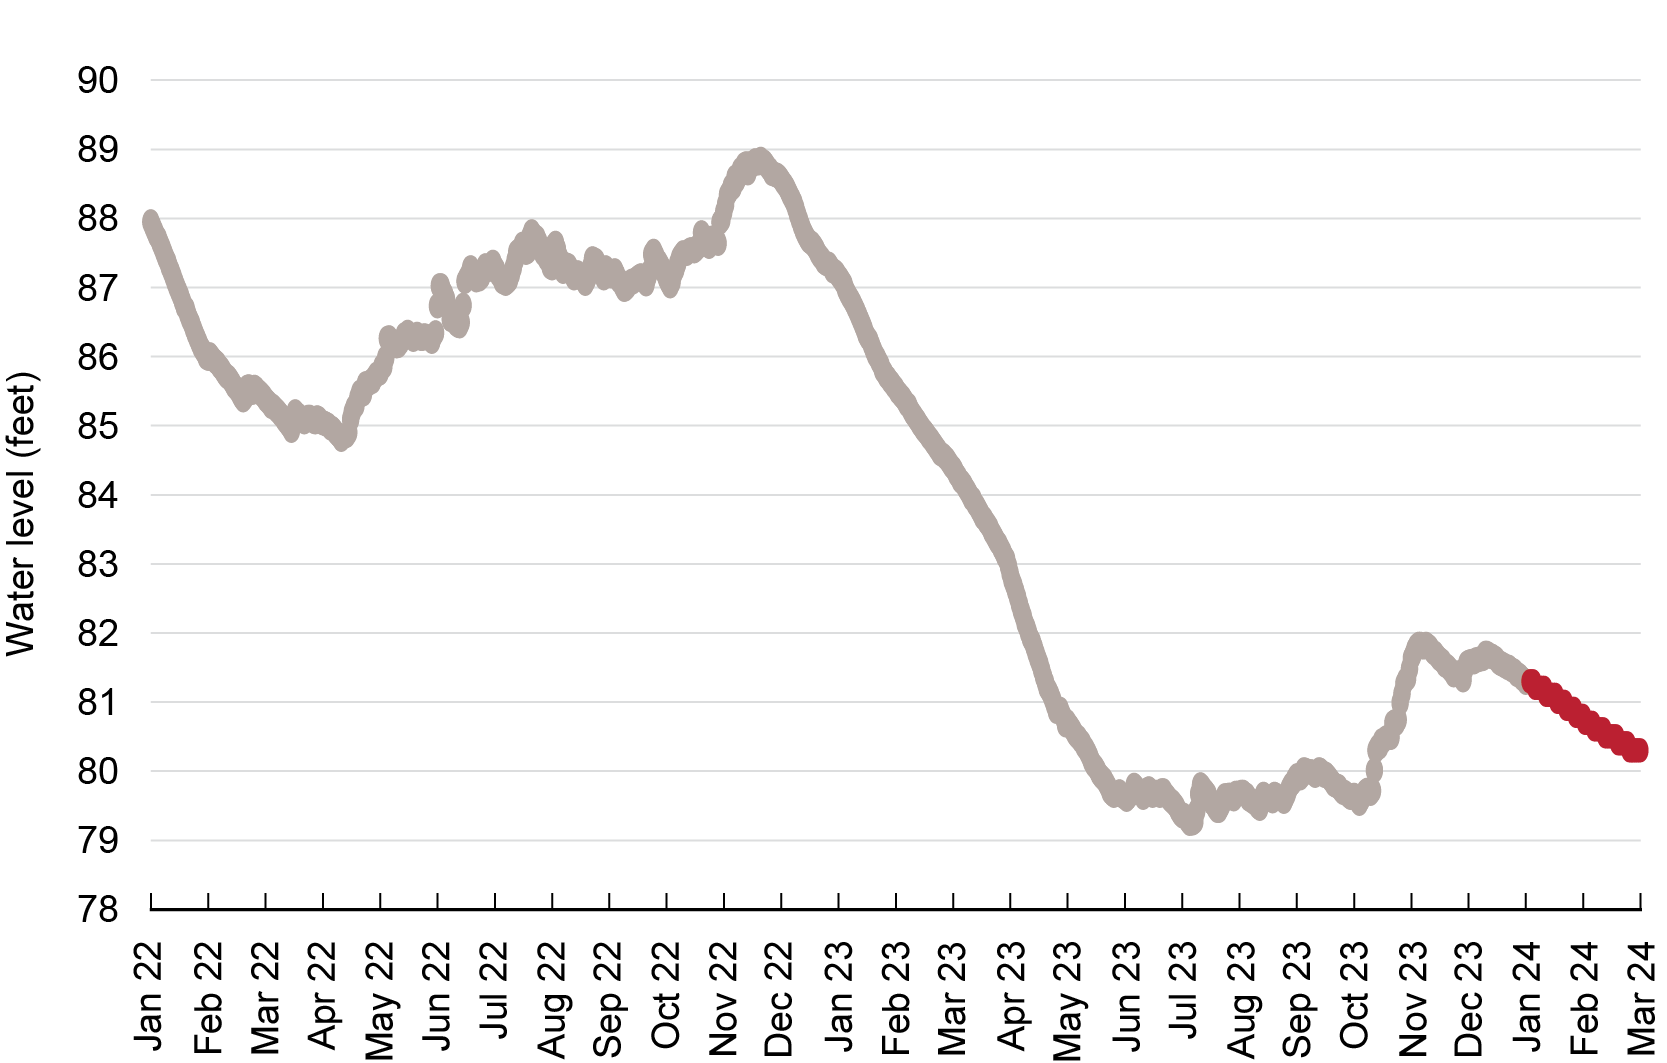
SOURCE: Panama Canal Authority, Gatun Water Level Indicators as of January 24, 2024. https://evtms-rpts.pancanal.com/eng/h2o/index.htmll
Figure 2: Panama Canal
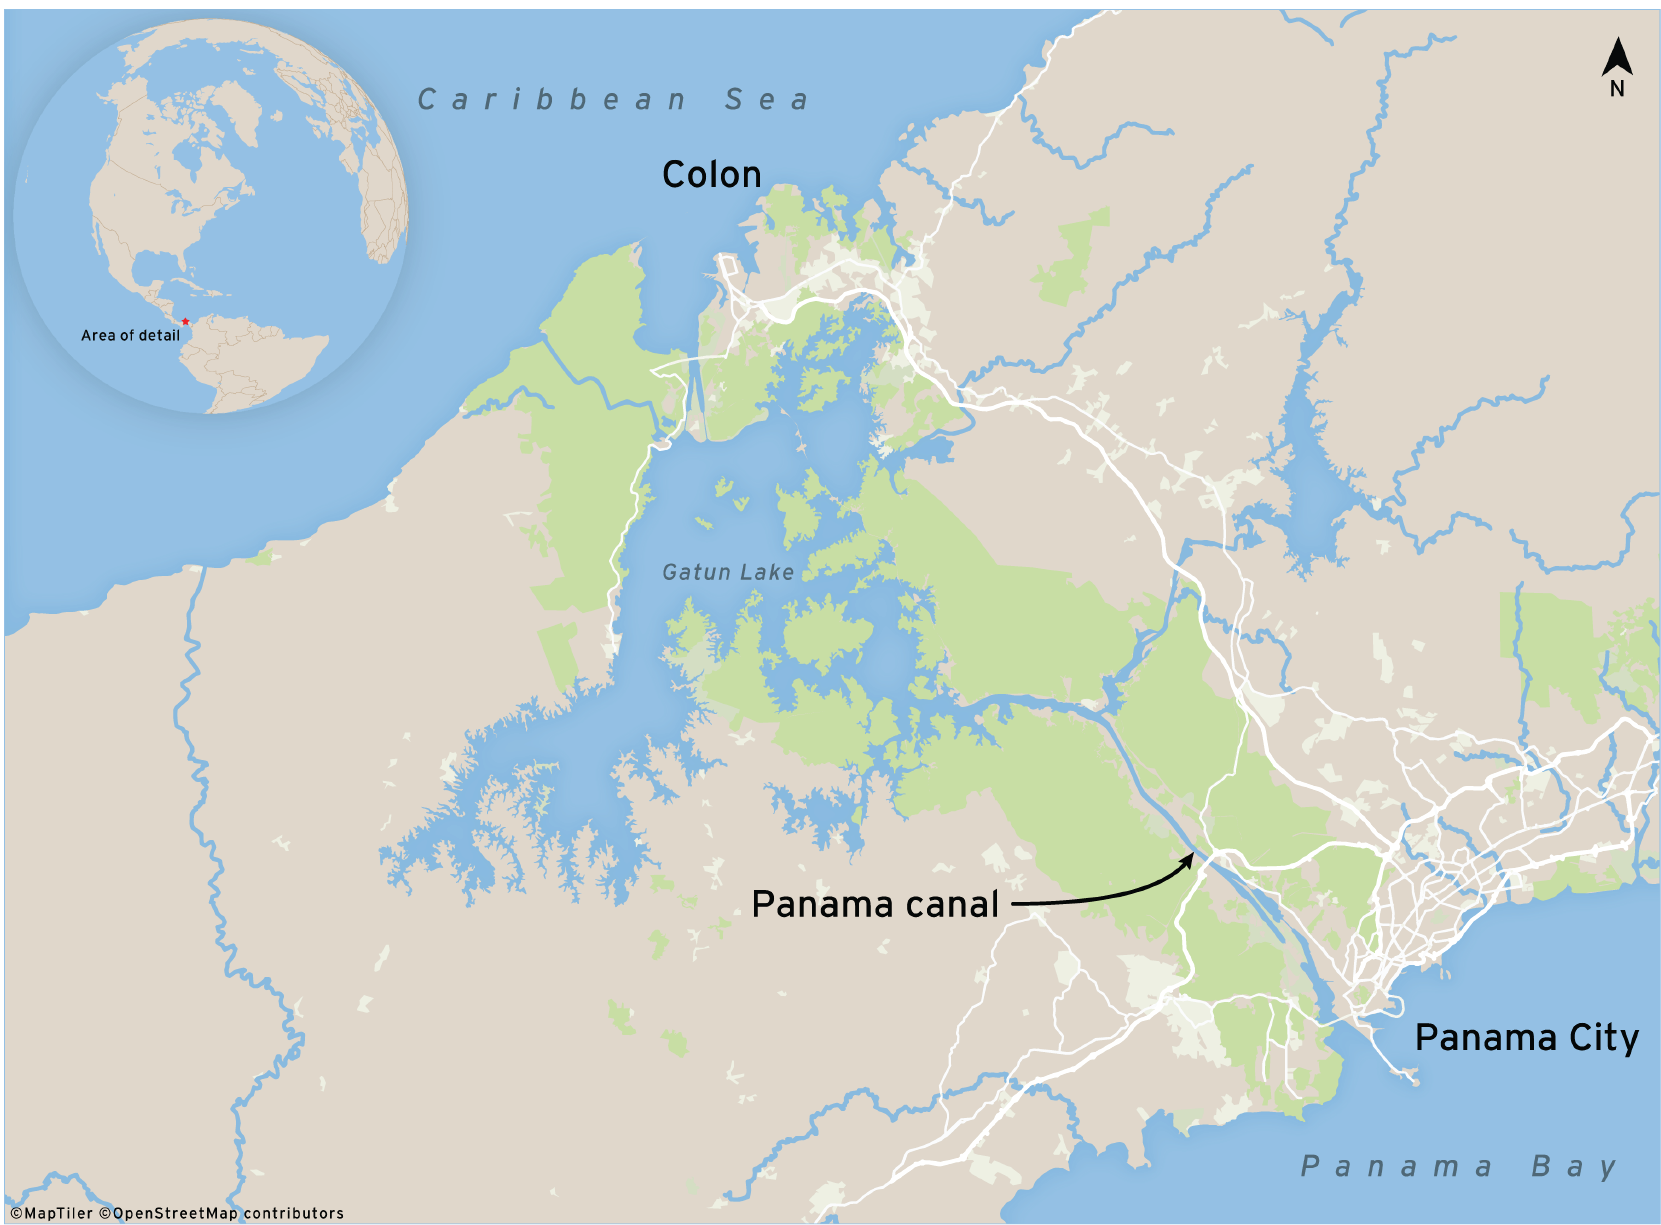
Figure 3: Commercial Transits through the Panama Canal by Month, FY2022 and FY2023
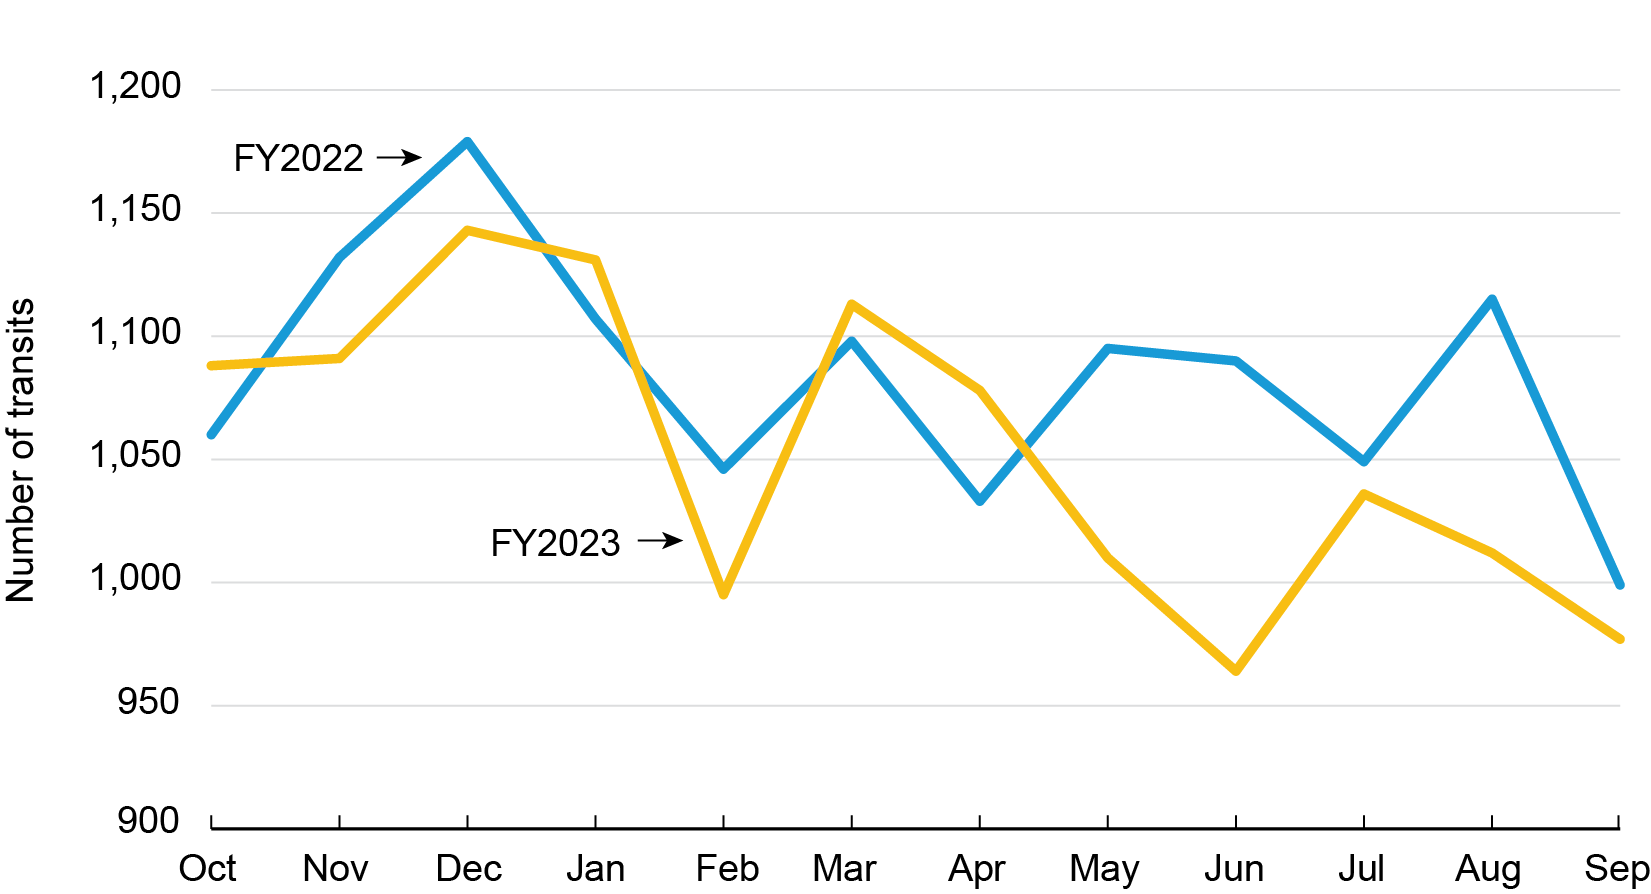
SOURCE: Panama Canal Authority, Oceangoing Commercial Traffic Through the Panama Canal by Month. as of February 2, 2024. https://pancanal.com/wp-content/uploads/2023/11/02-Oceangoing-Commercial-Traffic-Through-the-Panama-Canal-by-Month.pdf
Figure 4: Cargo (long tons) through the Panama Canal by Month, FY2022 and FY2023
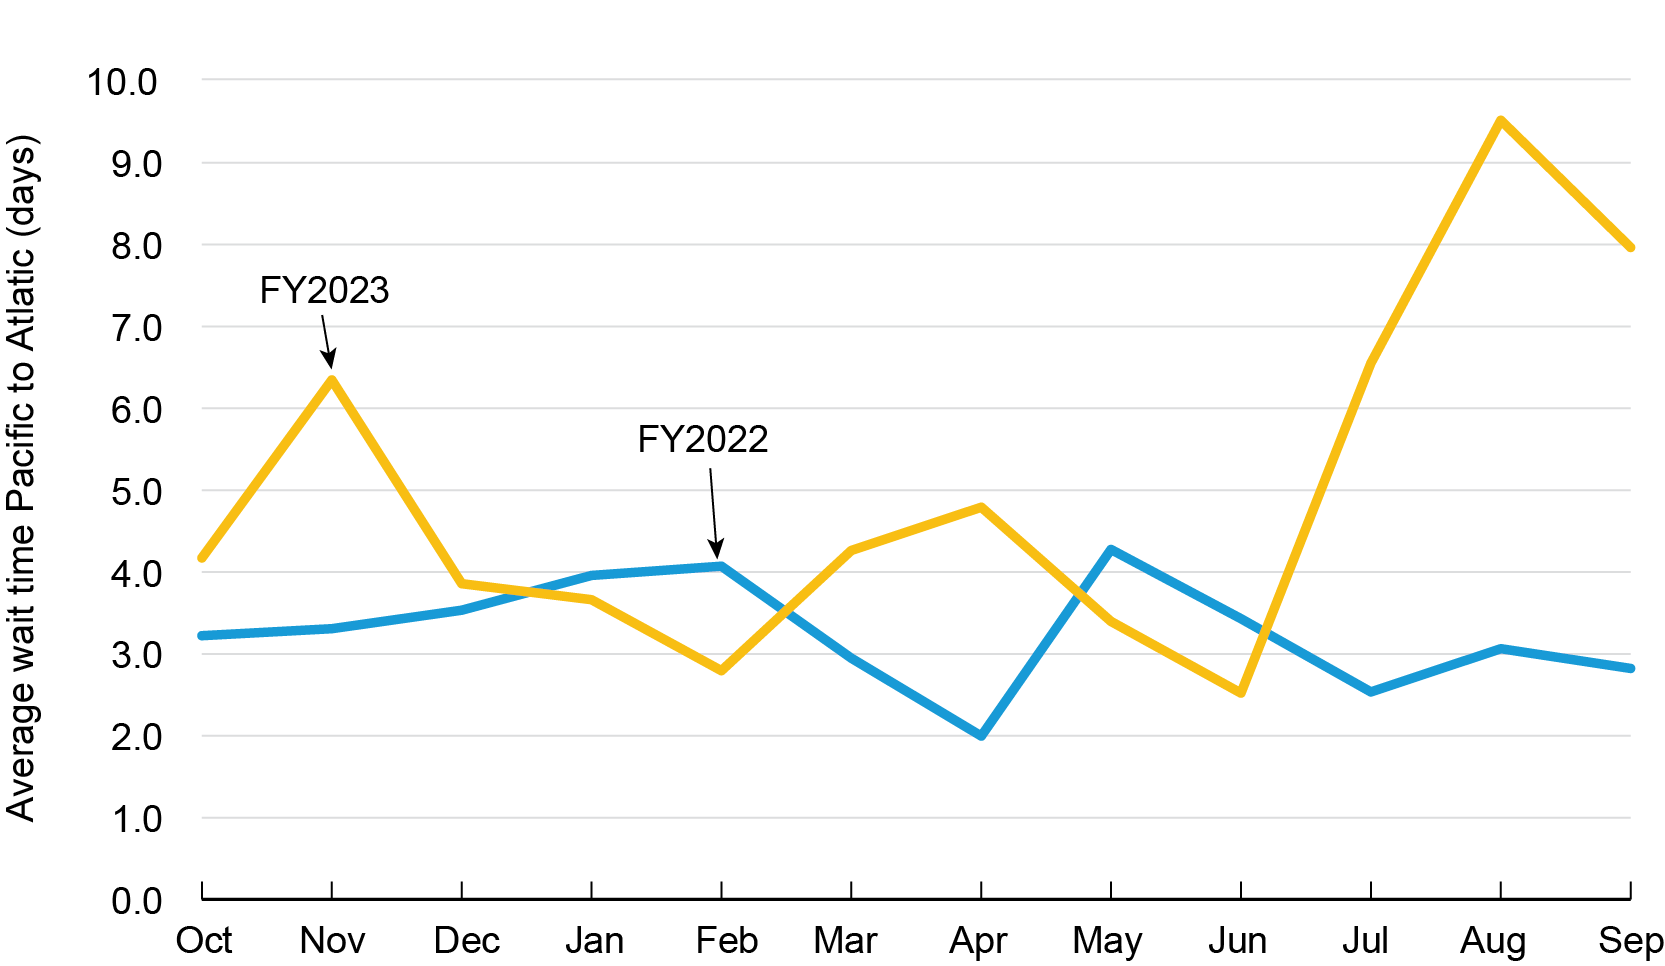
This situation may impact the flow of goods to the United States as ships without reservations with the Authority could be delayed, as can be seen in Figure 5. Ships have taken alternative routes and methods to reach the United States, including sailing around South America, participating in special transit auctions through the Authority, or choosing other routes altogether. For instance, to reduce their draft, some carriers have opted to have containers unloaded onto rail, shipped across Panama, and reloaded onto the ship after the ship has transited the canal.12 13 Additionally, as quoted on Nov. 9, 2023, in FreightWaves, “Instead of going through the Panama Canal, ships are going through the Suez [Canal] which is extending ton-miles.” Ton-miles is shipping demand measured in volume multiplied by distance.14 This increases costs to those countries importing U.S. agricultural products and shifts the volume and location of imports and exports between port gateways.
Figure 5: Average Wait Times for Northern bound traffic (Pacific to Atlantic) through the Panama Canal by Month, FY2022 and FY2023
1 A “long ton” is equal to 2,240 pounds.
2 https://pancanal.com/en/statistics/
3 Based on SCTC commodity code 03 – Agricultural products except for animal feed, cereal grains, and forage products https://bhs.econ.census.gov/bhsphpext/brdsearch/scs_code.html
4 https://www.bts.gov/faf
5 https://www.bts.gov/faf
6 https://pancanal.com/en/statistics/
7 https://apps.pancanal.com/t/TI/views/GatunH2OIndicators/GatunWaterLevel%3AisGuestRedirectFromVizportal=y&%3Aembed=y
8 https://evtms-rpts.pancanal.com/eng/h2o/index.html
9 https://pancanal.com/wp-content/uploads/2023/01/ADV48-2023-Reduction-in-Transits-Due-to-the-Ongoing-Deficit-in-Precipitation-in-the-Canal-Watershed.pdf
10 https://pancanal.com/wp-content/uploads/2023/01/ADV50-2023-REV1.-Additional-Auction-Slot-in-the-Panamax-Locks-and-Other-Modifications-to-the-Transit-Reservation-System-Rules.pdf
11 https://pancanal.com/maritime-services/informacion-para-clientes/
12 https://splash247.com/growing-panama-canal-congestion-a-rates-wildcard/
13 https://theloadstar.com/panama-canal-draught-restrictions-start-to-bite-sparking-liner-surcharges/
14 https://www.freightwaves.com/news/panama-canal-crisis-forces-us-farm-exports-to-detour-through-suez
