
Year-over-year declines in motor gasoline prices dampen inflation despite motor gasoline prices rising 10% from December 2022 to May 2023
Data spotlights represent data and statistics from a specific period of time, and do not reflect ongoing data collection. As individual spotlights are static stories, they are not subject to the Bureau of Transportation Statistics (BTS) web standards and may not be updated after their publication date. Please contact BTS to request updated information.
Consumers report few changes in travel behavior
The retail price for motor gasoline reached an all-time high of $5.03 in June 2022 (Figure 1). As of May 2023, the price for motor gasoline has declined 27% from that record high. The price of motor gasoline rose steadily from December 2022 to April 2023 and fell for the first time in 2023 in May, decreasing 1% from April 2023. The modest decline in May left the price for motor gasoline 10% above the December 2022 price. Despite remaining above the December 2022 price, the May 2023 price for motor gasoline is still 19% below the May 2022 level. January is the only month in 2023 where the price for motor gasoline was above the price for the same month in 2022. As a result, motor gasoline has not contributed to year-over-year inflation since January 2023.
Year-over-year, the price of all items (used to measure overall price inflation) has increased 4 to 6% in every month since January 2023 (Figure 2). If fuel prices had not declined year-over-year, the increase in all items would have been larger. In other words, prices for all items have continued to rise, but year-over-year declines in the price of motor gasoline have dampened inflation in February through May 2023.
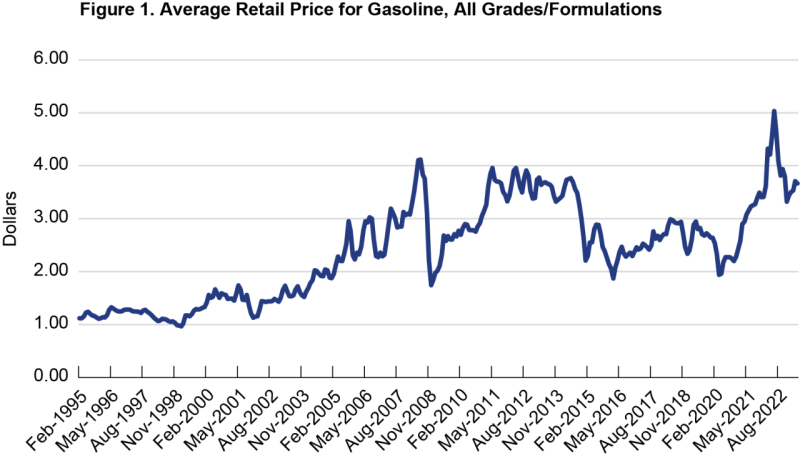
Source: Energy Information Administration, U.S. All Grades All Formulations Retail Gasoline Prices, available at https://www.eia.gov/dnav/pet/hist/LeafHandler.ashx?n=pet&s=emm_epm0_pte_nus_dpg&f=m as of May 2023.
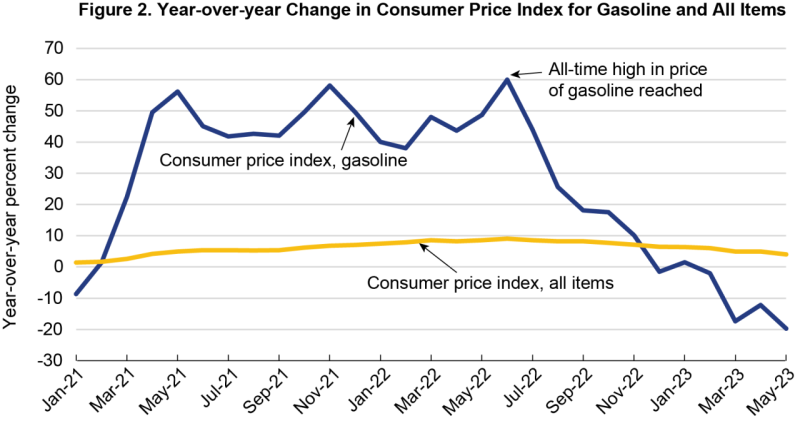
Note: Unadjusted change. Source: Bureau of Labor Statistics, Consumer Price Index, available at https://www.bls.gov/cpi as of June 2023.
Month-to-month gas price increases in 2023 having little impact on consumer travel behavior.
While year-over-year declines in the price of motor gasoline have dampened overall inflation, consumers have faced an increase in the price of fuel in the first four months of 2023 with only a modest decline in the most recent month. Despite the monthly increases, the percent of consumers reporting changes to their regular travel behavior remains the same. Since December 2022, about 40% of persons 18 and over skipped a trip due to the cost of gasoline, 30% combined trips, and 10% used an alternative mode (Figure 3). Respondents could choose to report one or more of these behavior changes. Only 45% reported making no change in the mode they used or in the number of trips they made.
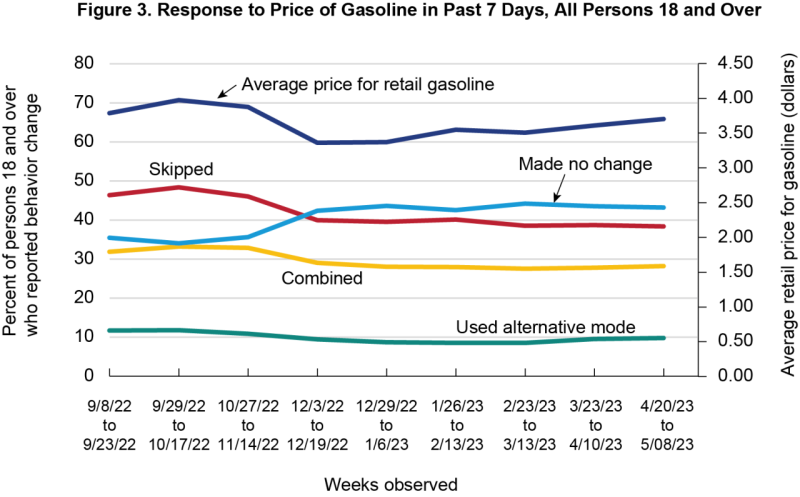
Source: Fuel: Energy Information Administration, U.S. All Grades All Formulations, available at https://www.eia.gov/dnav/pet/hist/LeafHandler.ashx?n=PET&s=EMM_EPM0_PTE_NUS_DPG&f=W as of June 2023. Consumer response: Census Bureau, Household Pulse Survey, table 5, available at https://www.census.gov/programs-surveys/household-pulse-survey/data.html as of June 2023.
In September 2022, gasoline prices were closer to $4.00. During that same month, response data indicated more persons age 18 or older reported reducing the number of trips (Figure 3). As the price of gasoline fell to about $3.50 in December 2022, fewer persons 18 and over reported skipping a trip and more stated they made no change in their travel behavior. The percent of persons over 18 who combined trips and/or used an alternative mode has remained nearly the same since data collection began in September 2022, at 30% and 10%, respectively.
Household income a factor in gas-price effect on consumer travel behavior.
Across all household incomes, consumers’ report little to no change in the modes used or number of trips taken since December 2022. However, the percentage of persons 18 and over reporting having skipped a trip, combined trips, or using an alternative mode is larger in lower income households (Figure 4). Just over 50% of persons 18 and over living in households with an income less than $50,000 reported skipping a trip due to the cost of gasoline. This percentage falls as income rises with fewer than 20% of persons 18 and over living in a household with an income of $200,000 or more reporting having skipped a trip due to the cost of gasoline. The percentage that reported combining trips is similar across all household incomes except the highest. In the highest income households ($200,000 or more), 20% of persons 18 and over report combining trips compared to about 30% in all other households. Contrastingly, a larger share of persons 18 and over living in the lowest income households reported using an alternative mode than all other households (20% compared to 10%, respectively).
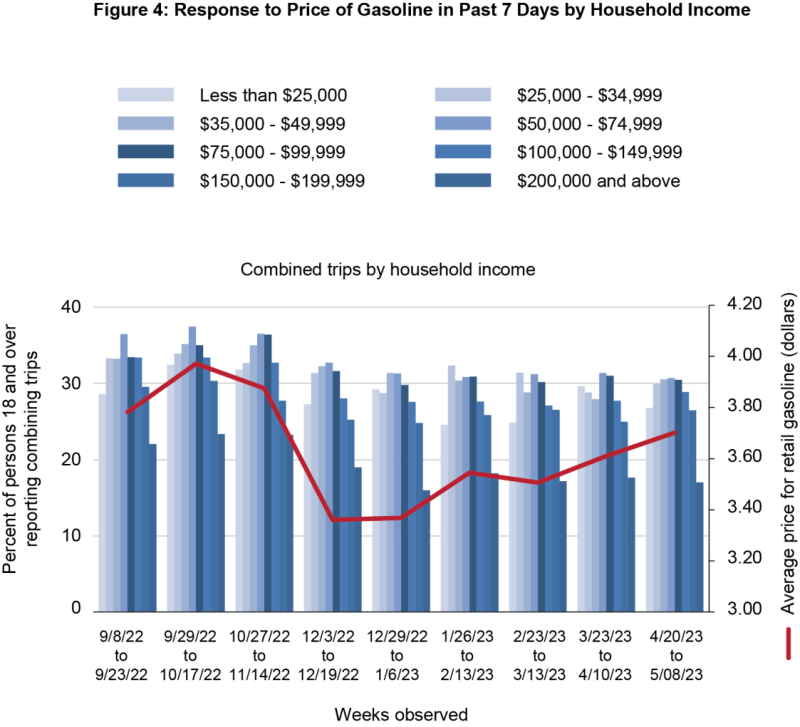
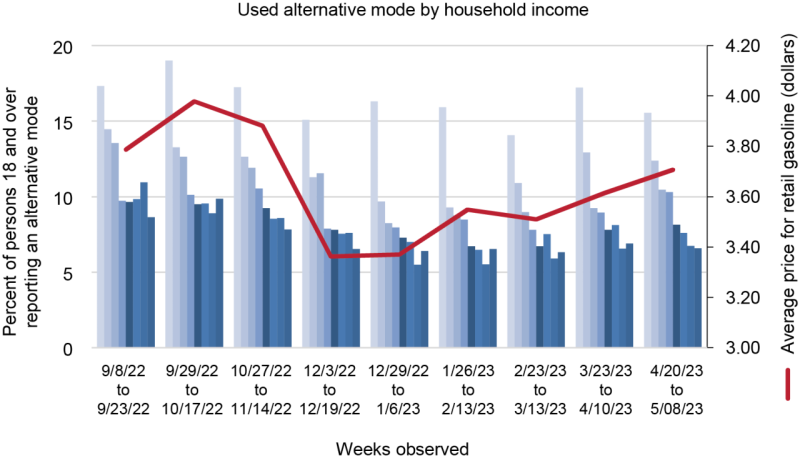
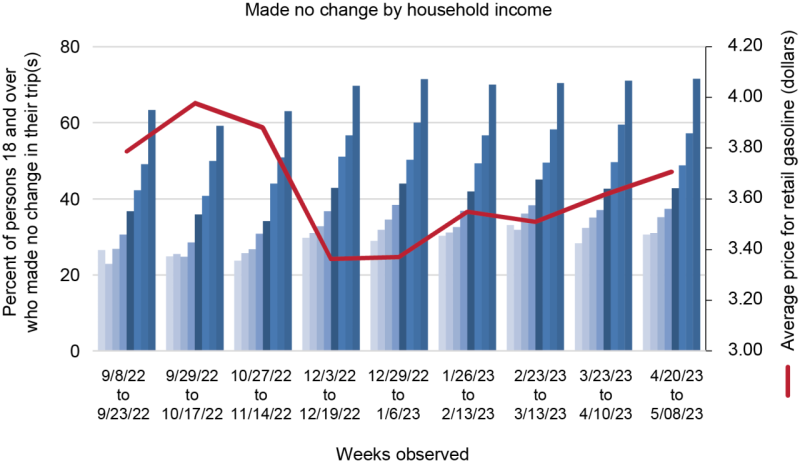
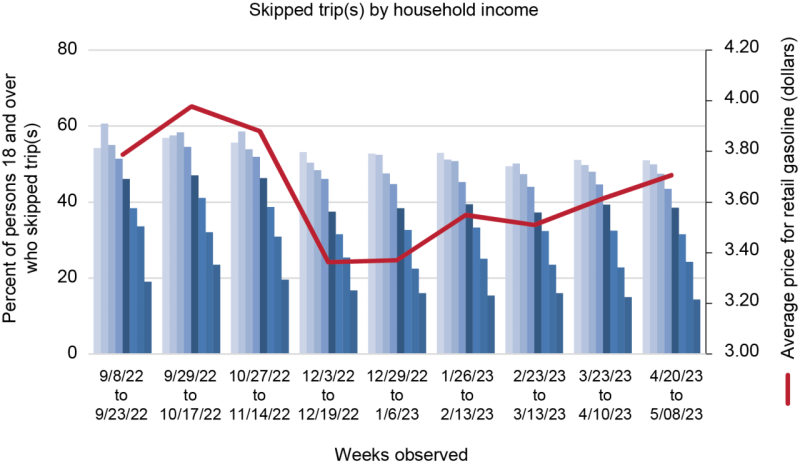
Source: Fuel: Energy Information Administration, U.S. All Grades All Formulations, available at https://www.eia.gov/dnav/pet/hist/LeafHandler.ashx?n=PET&s=EMM_EPM0_PTE_NUS_DPG&f=W as of June 2023. Consumer response: Census Bureau, Household Pulse Survey, table 5, available at https://www.census.gov/programs-surveys/household-pulse-survey/data.html as of June 2023.
Fuel prices are from the Energy Information Administration and are for all grade and all formulations. The contribution of gasoline to inflation and the Consumer Price Index are from the Bureau of Labor Statistics’ monthly news releases. Data on consumers’ responses to fuel prices are from the Census Bureau’s Household Pulse Survey. View the contribution of gasoline and other transportation items to inflation on the Bureau of Transportation Statistics’ website.