
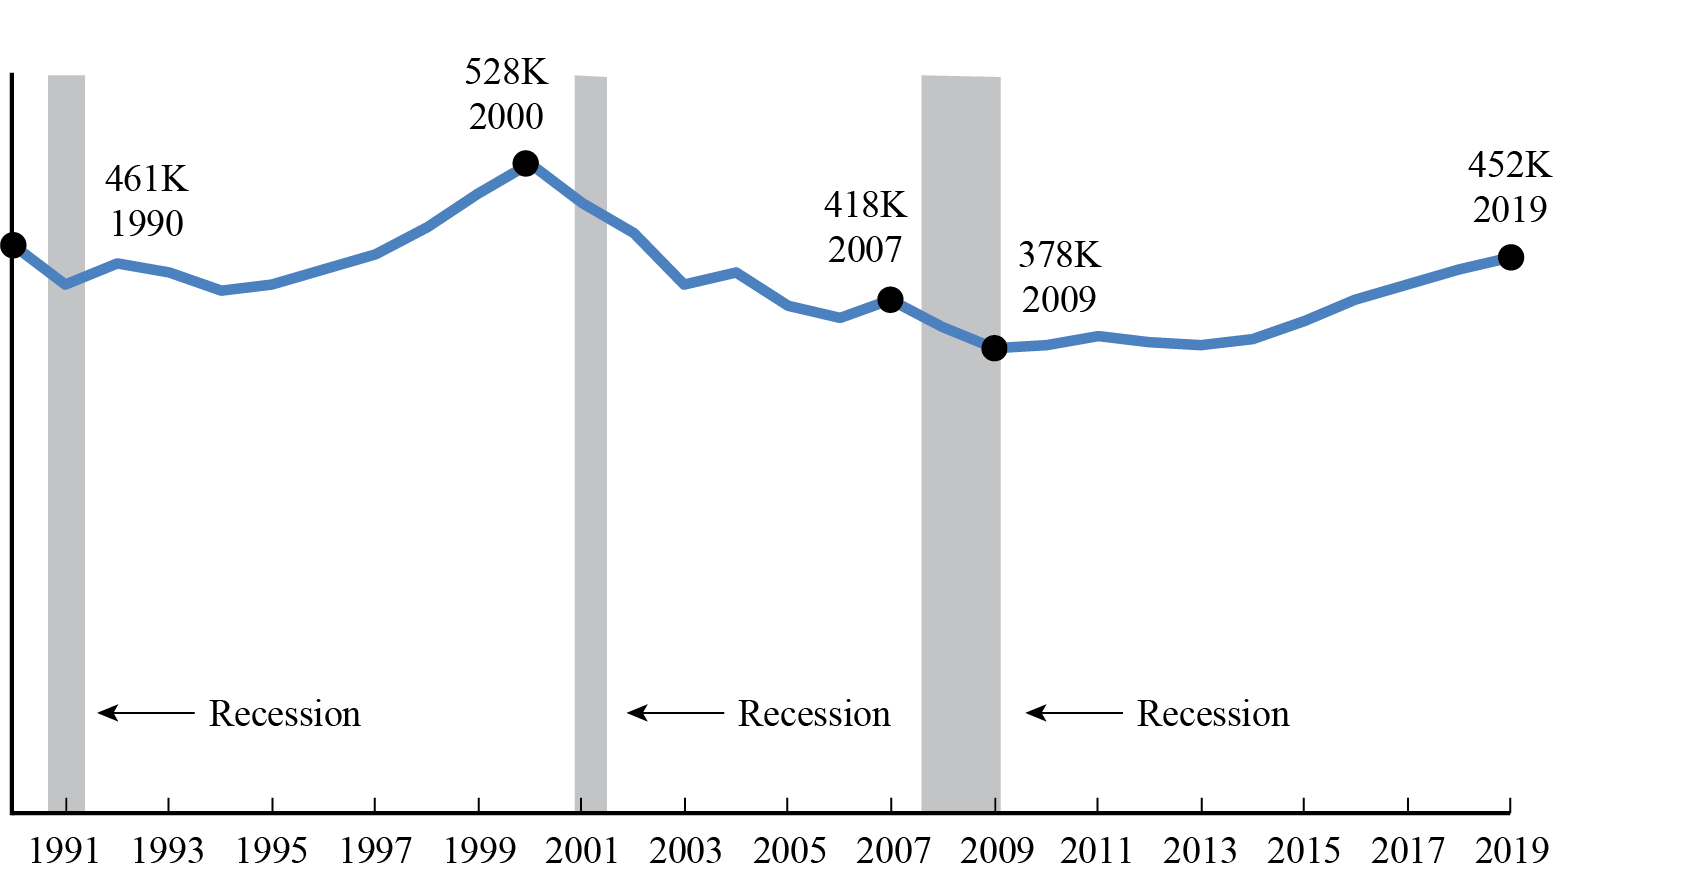
Employees at U.S. Scheduled Passenger Airlines Month of October, 1990-2019
(Full-Time Equivalents)
Figure
Dataset Table:
| October FTEs in thousands (000) | 1 | |
|---|---|---|
| 1990 | 461.2 | 2 |
| 1991 | 429.7 | 3 |
| 1992 | 446.1 | 4 |
| 1993 | 439.9 | 5 |
| 1994 | 425.4 | 6 |
| 1995 | 430.5 | 7 |
| 1996 | 440.9 | 8 |
| 1997 | 454.8 | 9 |
| 1998 | 477.3 | 10 |
| 1999 | 502.9 | 11 |
| 2000 | 527.6 | 12 |
| 2001 | 497.0 | 13 |
| 2002 | 471.9 | 14 |
| 2003 | 429.0 | 15 |
| 2004 | 439.2 | 16 |
| 2005 | 412.8 | 17 |
| 2006 | 402.9 | 18 |
| 2007 | 417.8 | 19 |
| 2008 | 394.2 | 20 |
| 2009 | 378.0 | 21 |
| 2010 | 379.2 | 22 |
| 2011 | 386.6 | 23 |
| 2012 | 382.3 | 24 |
| 2013 | 381.2 | 25 |
| 2014 | 384.7 | 26 |
| 2015 | 399.9 | 27 |
| 2016 | 416.0 | 28 |
| 2017 | 430.2 | 29 |
| 2018 | 441.1 | 30 |
| 2019 | 452.4 | 31 |
| 32 |
Notes:
FTE calculations count two part-time employees as one full-time employee.
Source:
Bureau of Transportation Statistics