
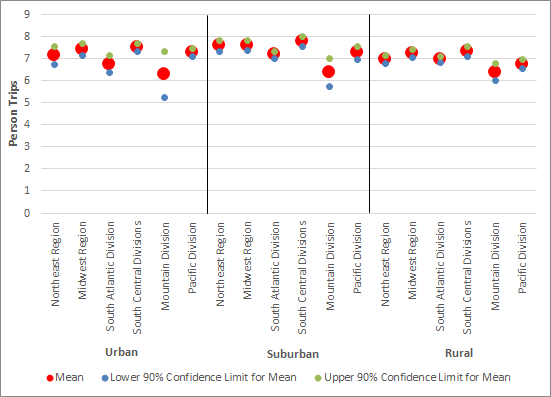
Figure 2. NHTS Mean Person Trips and 90% Confidence Intervals
Figure
Dataset Excel:
LATCH_methodology_figure2.xlsx (20 KB)Description:
Return to all tables and figures in the Bureau of Transportation Statistics’ 2017 Local Area Transportation Characteristics by Household methodology