
Transportation Geography of the United States 2025
Figure
Description:
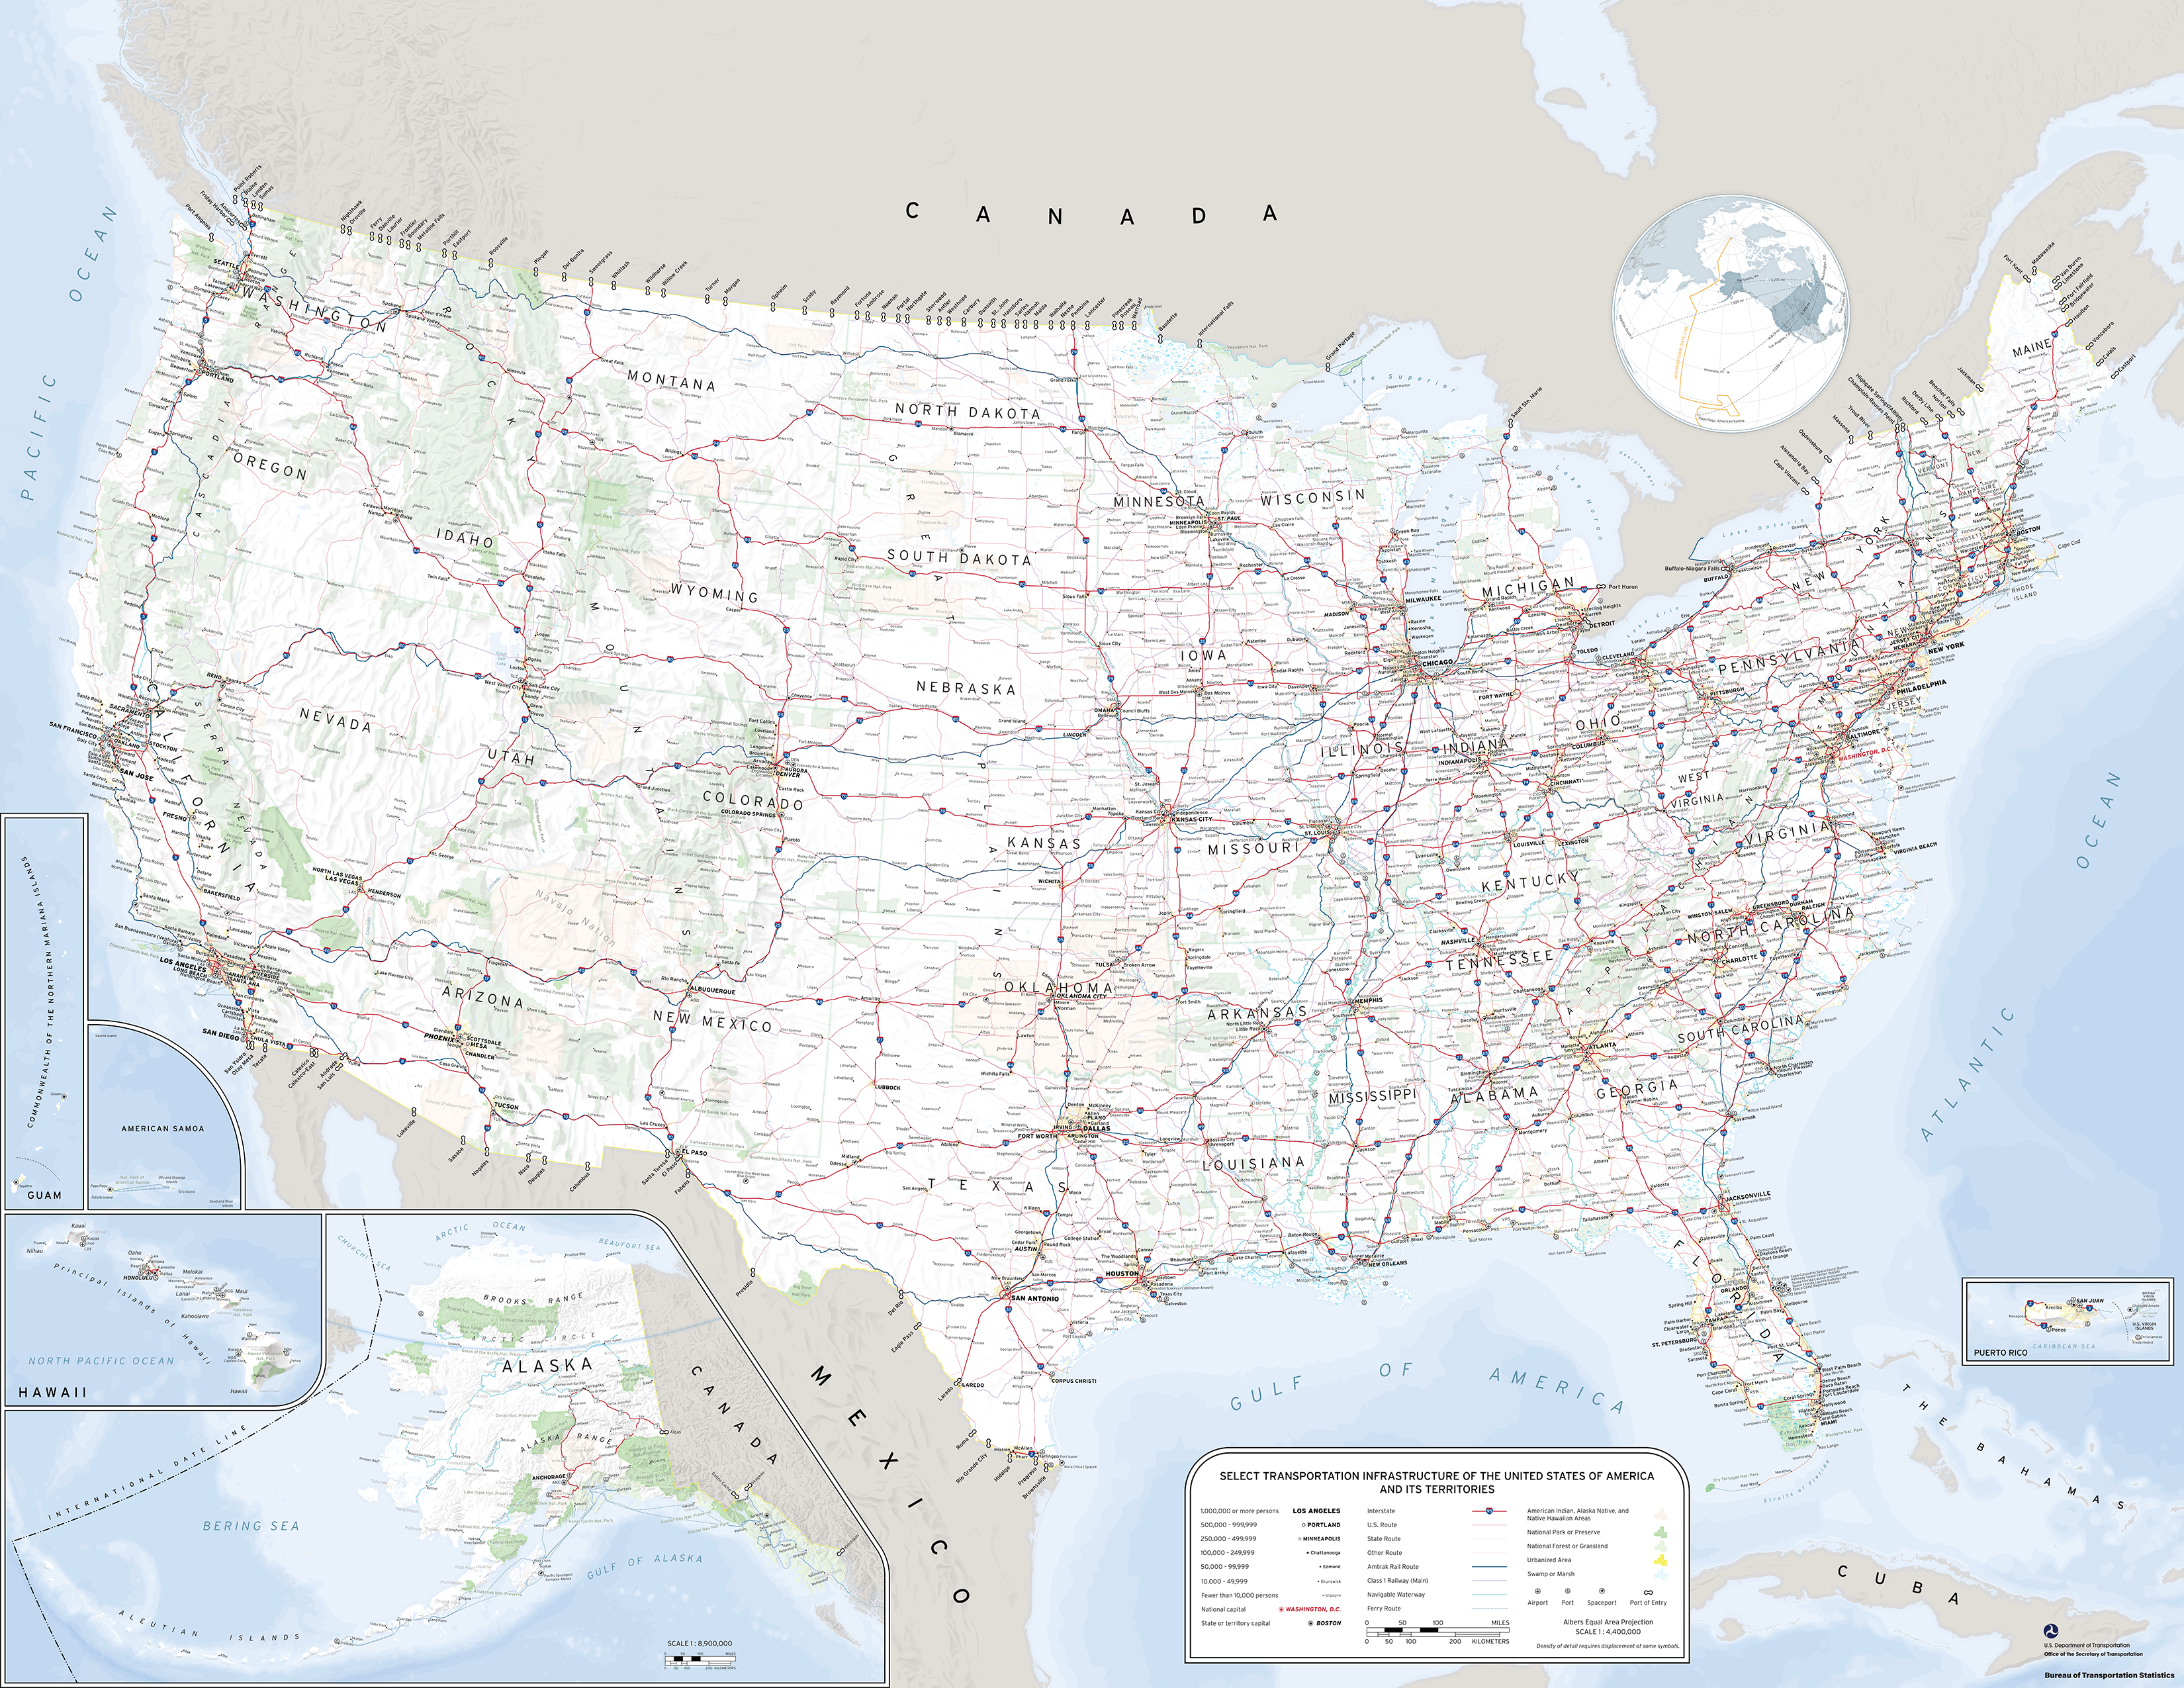
Select Transportation Infrastructure of the United States and its Territories
View the full-size pdf (78MB).
Front:
Description
The front side of our 2-sided print map, Transportation Geography of the U.S. 2025, showing:
- Major airports;
- Major marine ports;
- Navigable waterways;
- Person border crossings;
- Interstate highways;
- US, State, and County highways;
- Amtrak routes; and
- Class 1 rail lines.
NOTES: Major airports include only airports with 1 million enplanements or more in 2023. Border crossings are shown for all passenger ports of entry with a road border crossing. Density of detail requires minor displacement of some symbols. This map should not be used for navigational purposes.
SOURCE: U.S. Department of Transportation, Bureau of Transportation Statistics, National Transportation Atlas Database, 2024. United States Geological Survey Domestic Names and Geographic Information System (GNIS), 2024.
Back
Percentage of Trucks with Automatic Emergency Braking: Vehicle Inventory and Use Survey (VIUS) 2021
NOTE: The 2021 VIUS is a survey of 67,952 gross vehicle weight rating (GVWR) class 1 through 8 vehicles including vehicle body types, such as pickups, SUVs, minivans, light vans, straight trucks, and truck tractors
SOURCE: U.S. Department of Transportation, Bureau of Transportation Statistics; and, U.S. Department of Commerce, U.S. Census Bureau. In-use Vehicles by Registration State, Vehicle Type, and Trailer Configuration: 2021 [VIUSC2021]. 2021 Vehicle Inventory and Use Survey. U.S. Department of Transportation, Bureau of Transportation Statistics; U.S. Department of Commerce, U.S. Census Bureau; U.S. Department of Transportation, Federal Highway Administration; U.S. Department of Energy, 2021.
Transportation Required per Dollar of Output by Industry or Sector (cents), 2022
NOTE: "Other" for-hire transportation includes: transit and passenger ground transportation (excluding state and local government passenger transit); sightseeing transportation and transportation support; parcel delivery, courier, and messenger services (excluding U.S. Postal Service); warehousing and storage; and other transportation and support activities.
SOURCE: U.S. Department of Transportation, Bureau of Transportation Statistics, Transportation Satellite Accounts, 2023.
Freight Flows by Highway, Railway, and Waterway
Highway: U.S. Department of Transportation, Bureau of Transportation Statistics and Federal Highway Administration, Freight Analysis Framework, version 5.4, 2022; Rail: Based on Surface Transportation Board, Annual Carload Waybill Sample and rail freight flow assignment done by Federal Railroad Administration, 2019; Inland Waterways: U.S. Army Corps of Engineers, Institute of Water Resources, Annual Vessel Operating Activity and Lock Performance Monitoring System data, 2022.
Monthly Major Airport Delays by Cause
NOTE: Major airports include the top twenty-five airports by flight counts.
Causes of Delay:
· Air Carrier Delay: The cause of the cancellation or delay was due to circumstances within the airline’s control (e.g. maintenance or crew problems, etc.).
· Extreme Weather Delay: Significant meteorological conditions (actual or forecasted) that, in the judgment of the carrier, delays or prevents the operation of a flight.
· National Aviation System Delay: Delays and cancellations attributable to the national aviation system refer to a broad set of conditions — non-extreme weather conditions, airport operations, heavy traffic volume, air traffic control, etc.
· Security Delay: Delays caused by evacuation of terminal or concourse, re-boarding of aircraft because of security breach, inoperative screening equipment and long lines more than 29 minutes at screening areas.
· Late Arriving Aircraft Delay: Previous flight with same aircraft arrived late which caused the present flight to depart late
SOURCE: U.S. Department of Transportation, Bureau of Transportation Statistics, TranStats T-100 Domestic Segment (All Carriers), 2023.