
Top 25 U.S.-International Freight Gateways by Value of Shipments: 2016
Figure
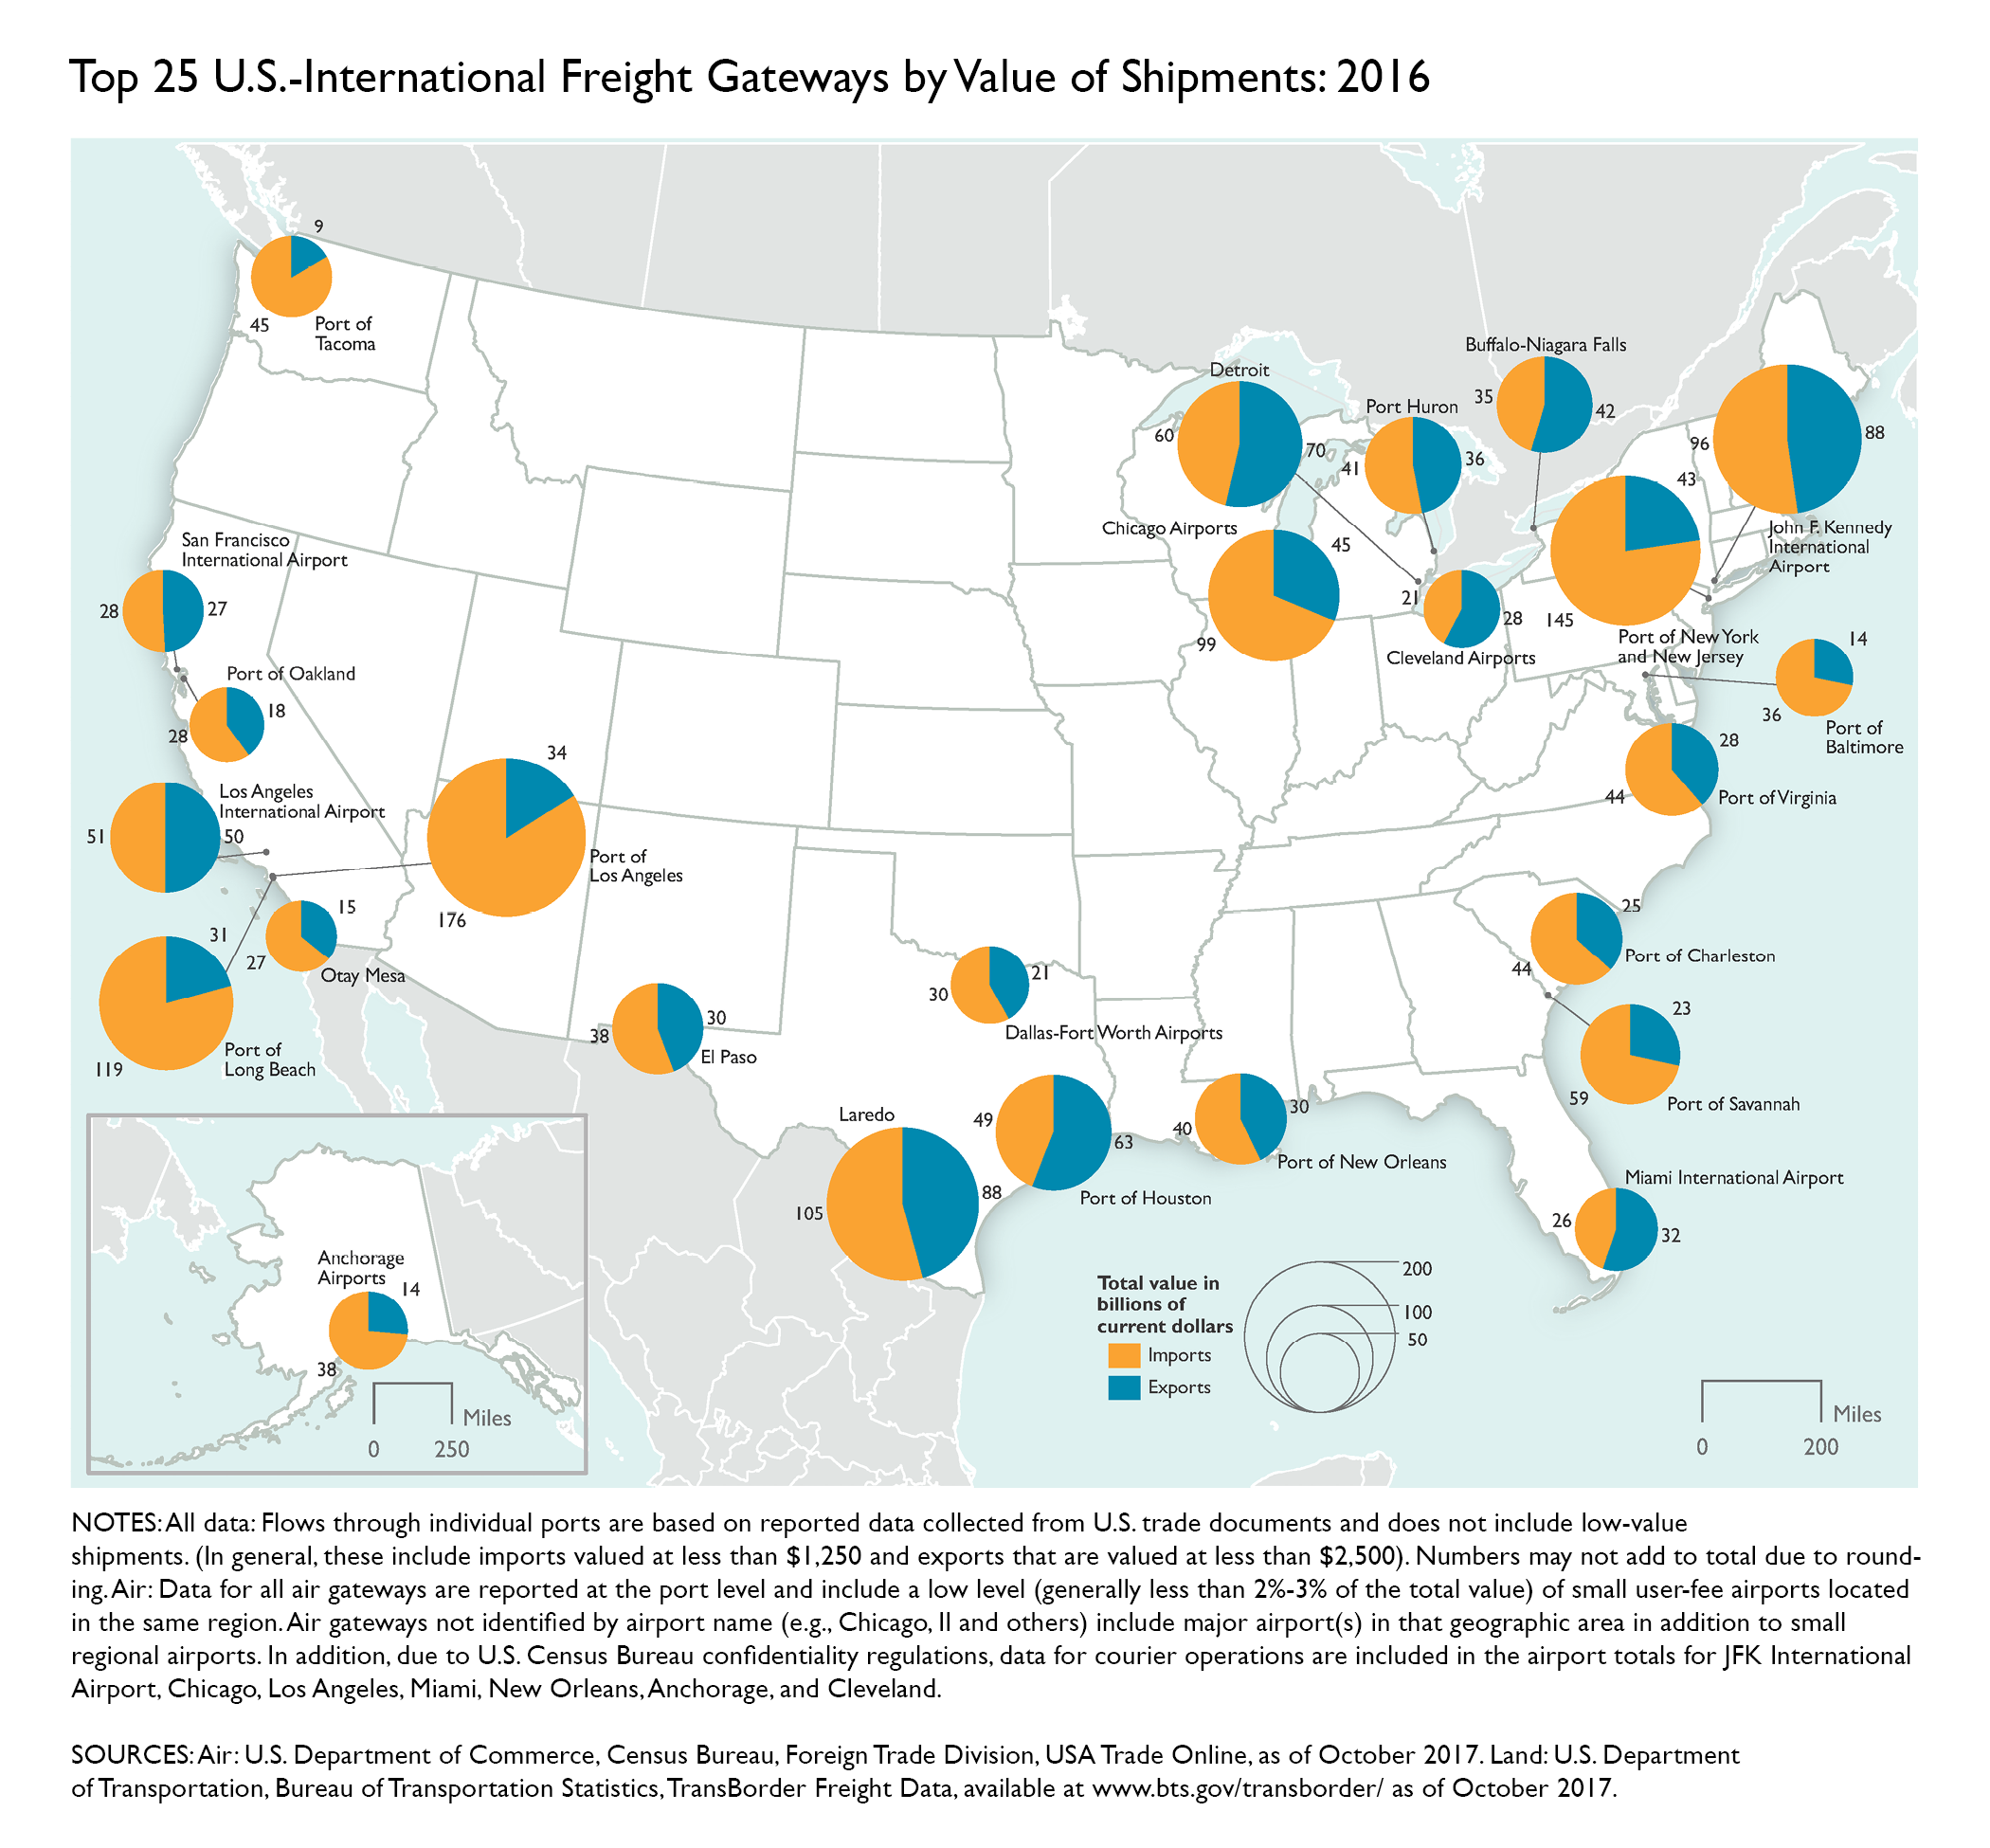
Notes:
All data: Flows through individual ports are based on reported data collected from U.S. trade documents and does not include low-value shipments. (In general, these include imports valued at less than $1,250 and exports that are valued at less than $2,500). Numbers may not add to total due to rounding. Air: Data for all air gateways are reported at the port level and include a low level (generally less than 2%-3% of the total value) of small user-fee airports located in the same region. Air gateways not identified by airport name (e.g., Chicago, Il and others) include major airport(s) in that geographic area in addition to small regional airports. In addition, due to U.S. Census Bureau confidentiality regulations, data for courier operations are included in the airport totals for JFK International Airport, Chicago, Los Angeles, Miami, New Orleans, Anchorage, and Cleveland.
Description:
This map is included in the Transportation Statistics Annual Report 2018 publication.
Source:
Air: U.S. Department of Commerce, Census Bureau, Foreign Trade Division, USA Trade Online, as of October 2017. Land: U.S. Department of Transportation, Bureau of Transportation Statistics, TransBorder Freight Data, available at www.bts.gov/transborder/ as of October 2017.