Rural Transportation Statistics
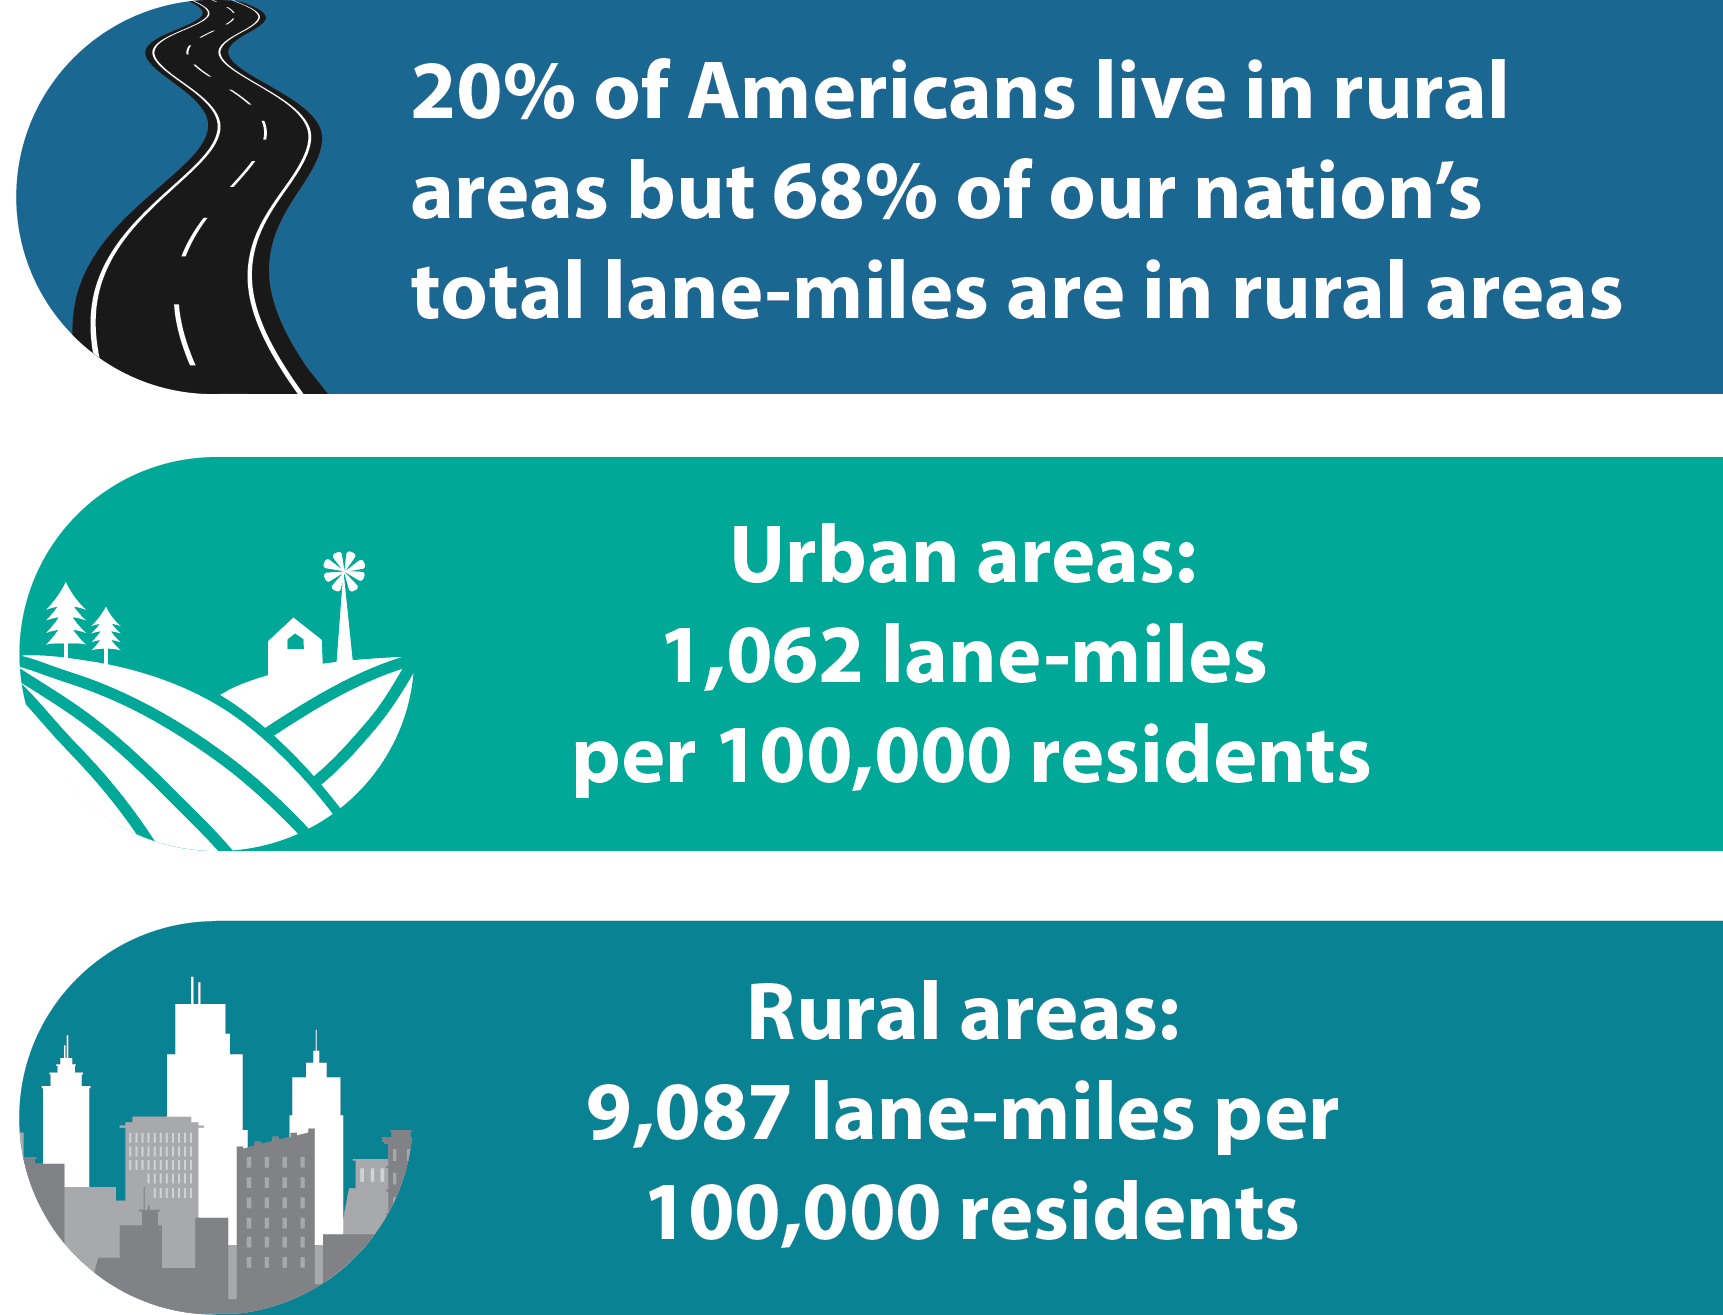
Rural roads account for a significant proportion of total lane miles in the United States, and they play a significant role in our nation’s transportation system, safely moving people and goods to their destinations.

- Sources: U.S. Department of Transportation, Federal Highway Administration, Office of Highway Information Management, Highway Statistics 2022, Table HM-60; United States Census Bureau, American Community Survey (ACS), 5-Year Estimates, 2022.
- Notes: For ACS population estimates, urban = Census urbanized area, 2020, rural otherwise; for FHWA Highway Statistics, urban = FHWA adjusted urbanized areas, 2020, rural otherwise; all statistics include Puerto Rico but do not include the US Virgin Islands, American Samoa, Guam, and the Northern Marianas Islands
Safety
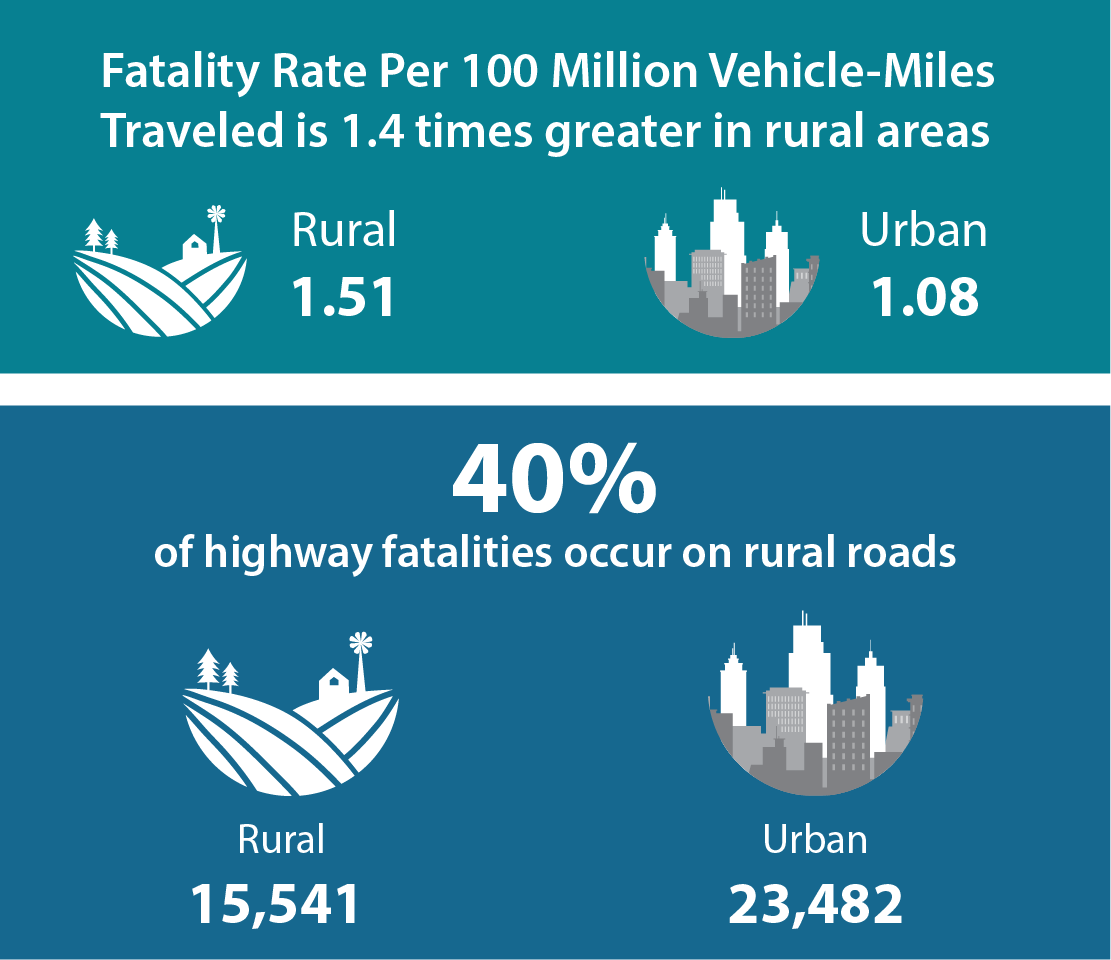
While only 20% of the U.S. population lives in rural areas, 40% of all roadway fatalities occur on rural roads, and the fatality rate on rural roads is almost 1.4 times higher than on urban roads.

- Sources: U.S. Department of Transportation, Federal Highway Administration, Office of Highway Information Management, Highway Statistics 2022, Table VM-1; National Highway Traffic Safety Administration, Fatality Analysis Reporting System, 2022.
- Notes: Urban = FHWA adjusted urbanized areas, 2020, rural otherwise; all statistics include Puerto Rico but do not include US Virgin Islands, American Samoa, Guam, and the Northern Marianas Islands
Usage
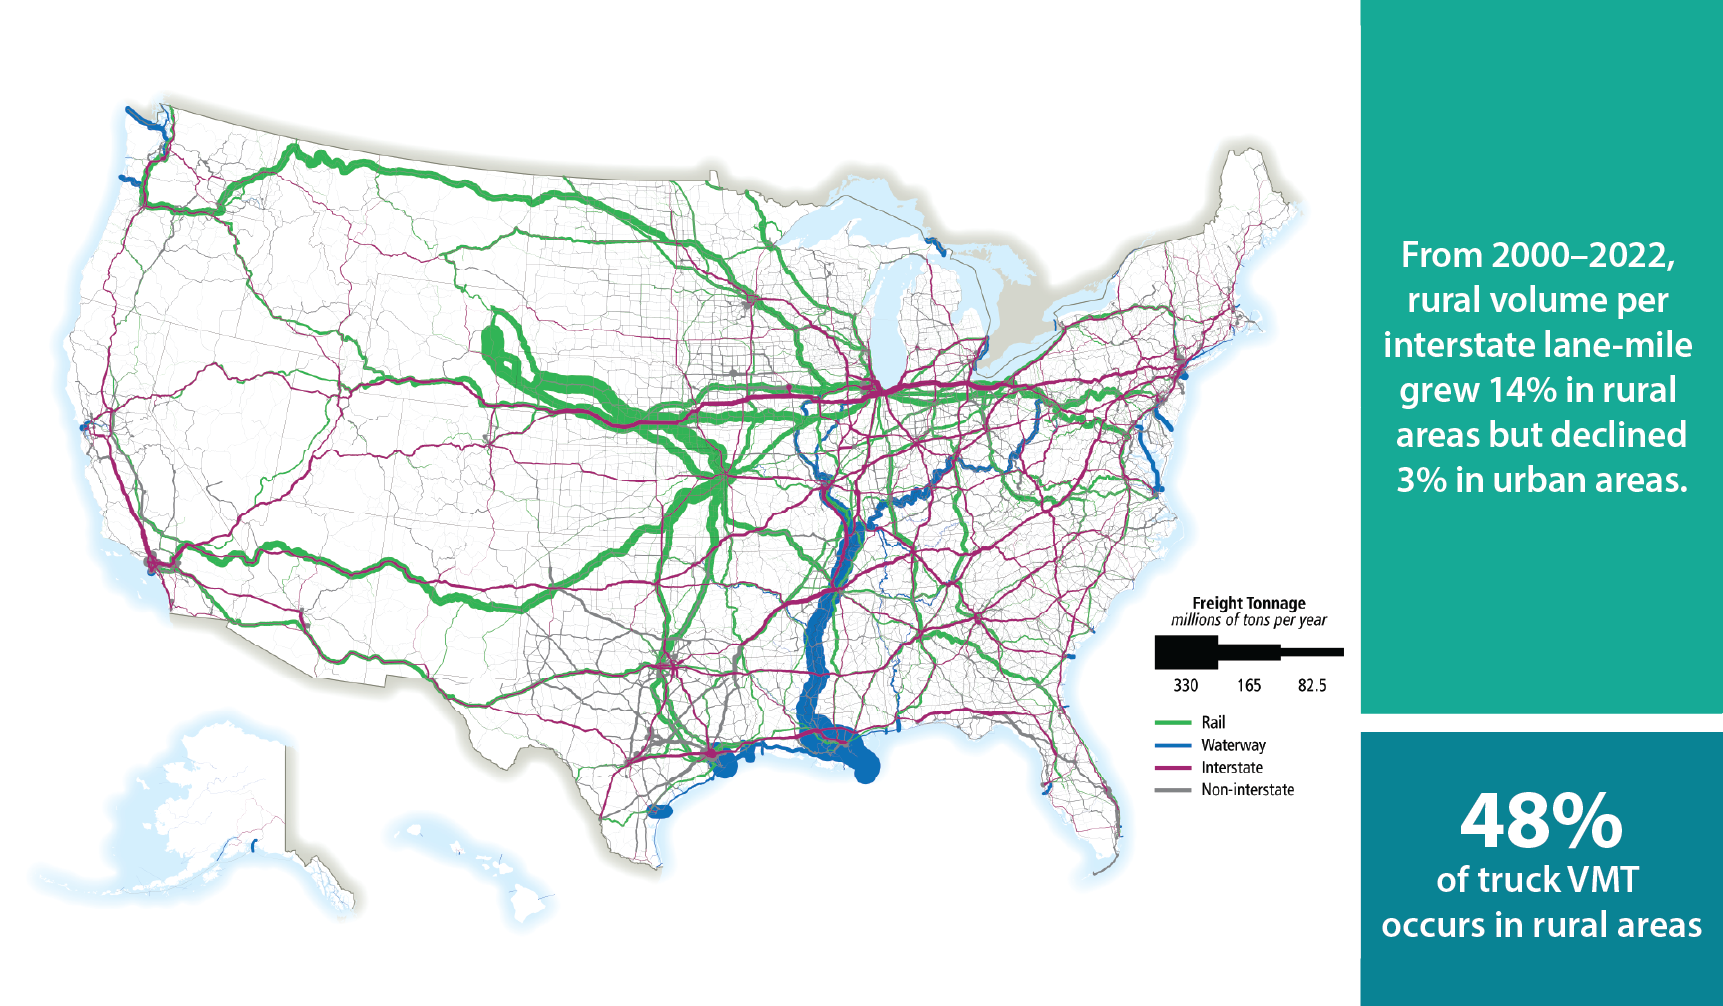
Large volumes of freight either originate in rural areas or are transported through rural areas on the nation’s highways, railways, and inland waterways.

- Sources: U.S. Department of Transportation, Bureau of Transportation Statistics, Freight Analysis Framework Version 5.4, September 2022; U.S. Department of Transportation, Federal Highway Administration, Office of Highway Information Management, Highway Statistics 2022, Table VM-1; U.S. Department of Transportation, Federal Highway Administration, Office of Highway Information Management, Highway Statistics 2000, Table VM-2 and Table HM-60; U.S. Department of Transportation, Federal Highway Administration, Office of Highway Information Management, Highway Statistics 2022, Table VM-2 and Table HM-60
- Notes: Urban = FHWA adjusted urbanized area, 2020, rural otherwise; excludes Puerto Rico, US Virgin Islands, American Samoa, Guam, and the Northern Marianas Islands.
Infrastructure Condition
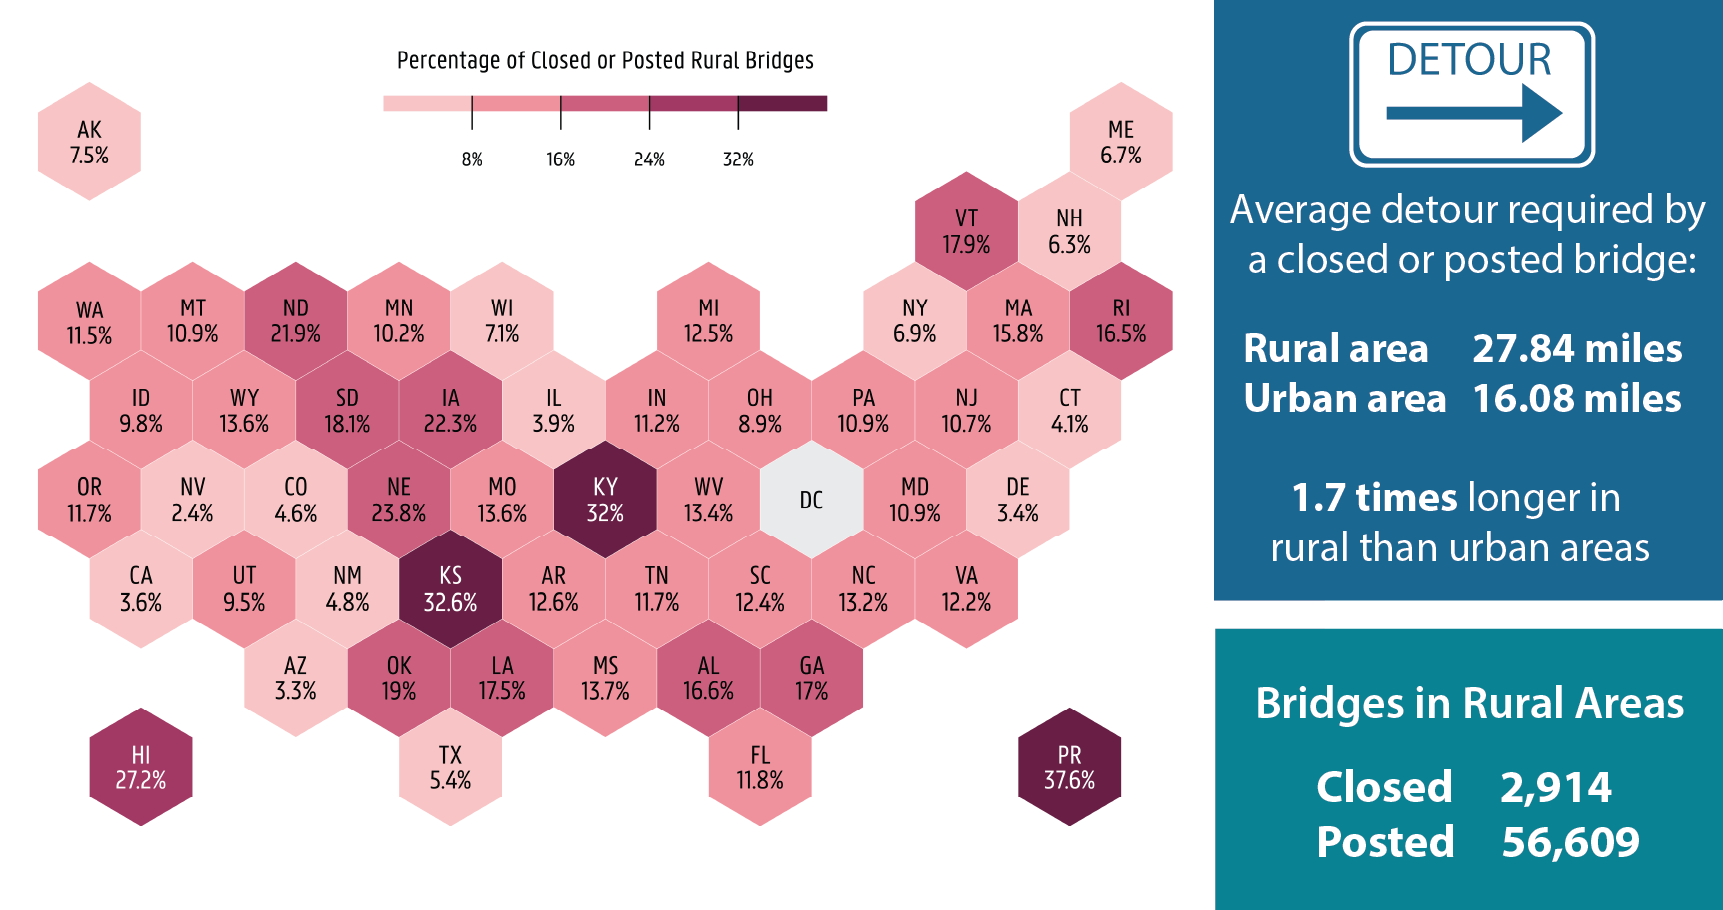
The condition of our nation’s rural transportation infrastructure varies between urban and rural areas, too. Rural bridges that are closed or posted, for example, require American travelers to make detours nearly twice as long as those necessitated by their urban counterparts.

- Sources: U.S. Department of Transportation, Federal Highway Administration, National Bridge Inventory (NBI)
- Notes: Bridges in poor condition include any bridge where any of four condition attributes are poor or worse, as defined by FHWA; Urban = Bridges whose road classification is within an FHWA adjusted urbanized area, 2020, rural otherwise; bridge statistics include Puerto Rico but do not include the US Virgin Islands, American Samoa, Guam, and the Northern Marianas Islands
