
What the Transportation Services Index, Dow Transportation Index, and Cass Freight Index Tell Us
Economic indicators provide insights about the economy and inform analyses and predictions about economic health. The Bureau of Transportation Statistics (BTS) Transportation Services Index (TSI), the Dow Transportation Index, and the Cass Freight Index represent transportation economic indicators that reflect the responses of transportation providers to the economy’s demands for moving freight and/or passengers. Economic growth reflects increases in the production and demand for goods and services. To produce more goods and deliver them to consumers, industries require additional freight transportation services, both for finished products and for raw material and intermediate goods all along the supply chain. Because the earlier stages of production can be particularly transportation intensive, transportation has been seen as an indicator of economic growth (and decline). Table 1 shows the differences among these three indexes. Because the three indexes are commonly cited together, the following describes each in further detail, highlights similarities and differences among the indexes, and describes what each index tells us about transportation and the economy.
Figure 1. Description of the Bureau of Transportation Statistics Freight Transportation Services Index, Dow Transportation Index, and Cass Freight Index
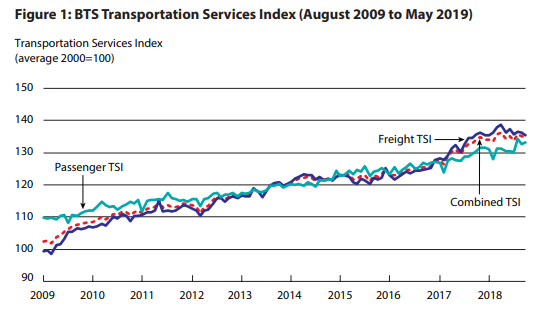
Table 1: Description of the Bureau of Transportation Statistics Freight Transportation Services Index, Dow Transportation Index, and Cass Freight Index
| Index | Basis | Frequency of publication | Release Date | Adjustments |
|---|---|---|---|---|
| BTS Freight Transportation Services Index | Ton miles shipped for five freight for-hire transportation modes. | Monthly | Data for given month released at the beginning of the month two months later | Seasonally adjusted and weighted by dollar contribution of the modes to the economy. |
| Dow Transportation Index | Stock prices of 20 large for-hire transportation companies. | Daily | Same day as day data calculated for | Periodic changes to the stocks in the index; adjusted for stock splits. |
| Cass Freight Index | Shipments and freight expenditures of shippers purchasing for-hire transportation using Cass Information Systems. | Monthly | Data for previous month released the month after | Tonnage is summed across modes. Not seasonally adjusted. |
Transportation Services Index
The BTS TSI measures the volume of freight and passengers moved. BTS produces three indexes: a freight index, a passenger index, and a combined index. The indexes incorporate monthly data on physical volumes – ton miles shipped for the freight index and passenger miles traveled for the passenger index – from multiple for-hire transportation industries (figure 1).[1] The TSI includes only domestic "for-hire" transportation that provides transport services to external customers for a fee. BTS seasonally adjusts, weights, and then combines monthly data for each for-hire mode. The input data are highly seasonal, reflecting trends such as stores increasing inventory for the holiday season.[2] BTS weights each series by the dollar contribution of the for-hire transportation mode to the economy (i.e., by economic value). The resulting indexes provide insight about transportation activity and the demand for transportation services in the US. BTS releases the TSI monthly with data for a given month released two months later.
Relationship of the Freight TSI to the Economy
BTS research shows that changes in the Freight TSI occur before accelerations and decelerations in the economy, making the TSI a useful economic indicator (figure 2).[3] Two economic accelerations followed the Great Recession (from December 2007 to June 2009): the first from June 2009 (marking the end of the recession) to December 2012, and the second from July 2013 to December 2014. BTS research shows that the freight TSI led both accelerations; however, the relationship between the freight TSI and these growth cycles changed somewhat.[4] First, the freight TSI turned twice before the December 2012 economic slowdown. Historically, the freight TSI had not turned twice before the onset of an economic deceleration. Second, the freight TSI peaked in December 2014 and turned downwards at the same time, rather than prior to, the December 2014 economic deceleration. Prior to the Great Recession, the freight TSI lead accelerations and decelerations in the economy by an average of approximately 4 months. Freight activity began to grow in September 2016, marked by the freight TSI turning upwards, and as of mid-2019, continues to grow.
Figure 2. Relationship of BTS Freight Transportation Services Index to Economic, January 1979 to December 2018

Dow Transportation Index
The Dow Transportation Index is an index of stock prices for twenty firms in the transportation industry (figure 3).[5] It combines daily common stock prices for these firms. Market valuations of these stocks drive the Dow Transportation Index, as well as the particular mix of stocks (which has changed several times since the index was created in 1884). The last change was in October 2015, when American Airlines Group replaced Con-Way, Inc. The discounted value of the cash flows associated with owning a stock determines stock prices – and thus rely on interest rates and company earnings. Because future earnings and cash flows cannot be known with certainty, speculation factors into stock prices, as stock purchasers attempt to outguess the market. Stock purchasers may be less concerned with actually forecasting cash flows, than with simply forecasting other investors views of cash flows and thus stock prices. The impact of such speculation on stock price patterns is a matter of debate among financial economists, but clearly the opinions of investors are a key factor in stock prices, adding one more layer between stock prices and underlying drivers such as shipment volumes S&P Dow Jones Indices LLC releases the Dow Transportation Index daily.
Figure 3. Dow Transportation Average Index and BTS Freight Transportation Services Index (August 2009 to May 2019)
")
Relationship of the Dow Transportation Index to BTS’ Freight TSI
The total volume of freight and passengers moved multiplied by the rate charged per ton mile and per passenger mile determines a transportation firm’s revenue, which less expenditures on labor, fuel, equipment, etc., equals company earnings. As such, the physical measures that the TSI tracks play a key role in the Dow Transportation Index. However, other factors – the rate charged per mile and fluctuations in costs (for example in fuel prices) as well as in interest rates (which the market uses to discount future earnings) – mean that the Dow Transportation Index moves differently than the TSI. The Dow Transportation Index also moves differently because transportation stock prices reflect future volumes (which impact the value of a stock), while TSI considers only current volumes. Additionally, the Dow Transportation Index includes a car rental company and an ocean going shipping company, which belong to industries not part of the TSI due to a lack of data. Finally, the Dow Transportation Index is an average of twenty stock values (adjusted for stock splits) and unlike the TSI, is not weighted by the economic value of the mode nor separated into a freight and passenger index. The Dow Transportation Index does not require seasonal adjustment because there is no theoretical basis to expect the existence of a seasonal pattern.
Cass Freight Index
The Cass Freight Index is based on shipment volumes and freight expenditures from freight transactions processed by Cass Information Systems (a private payment management company) on behalf of its clients (figure 4).[6] Clients include a broad range of industries, such as consumer packaged goods, automotive, chemical, retail and heavy equipment, shipping a variety of goods. The index covers all domestic freight modes, and expenditures are the amount paid to ship the goods. The Cass Freight Index is widely used as a measure of freight activity. Cass Information Systems releases the Cass Freight Index monthly with data for the previous month released the month after.
Figure 4. Cass Freight Index and BTS Freight Transportation Services Index

Relationship of the Cass Freight Index to BTS’ Freight TSI
The Cass Freight Index consists of two series, one based on expenditures to ship goods and one based on shipment volumes. Both are more conceptually similar to the Freight TSI than the Dow Transportation Index because both track actual freight shipments like the Freight TSI rather than stock prices. Also similar to the Freight TSI, both include data from multiple domestic freight modes. The data source (shipments handled by Cass) is proprietary, and the data are recorded in the month when Cass processes the transaction, not when the freight is shipped as in the TSI. The Cass shipment index is based on shipments across modes and is not seasonally adjusted nor weighted by economic value as the Freight TSI. The Cass expenditure index is implicitly weighted by expenditure per shipment, rather than the economic value added weights used by TSI.
The Dow Transportation Index, the Cass Freight Index, and BTS’ Freight TSI
In summary, the Dow Transportation Index is a good measure of how investors view the prospects for profitability in the transportation industry, while both the Cass Freight Index and BTS’ Freight TSI measure freight shipments directly. In comparison to the Cass Freight Index, BTS’ Freight TSI is a more comprehensive and transparent indicator, while the Cass Freight Index is more timely.
[1] The freight index is a weighted average of data for trucking, freight rail, waterborne, pipeline, and air freight. The passenger index is a weighted average of data for passenger aviation, transit, and passenger rail. The combined index is a weighted average of all these passenger and freight modes.
[2] Seasonal trends make it difficult to observe underlying long-term changes in the data, as well as monthly shifts and short-term trends, which are best viewed using seasonally adjusted data.
[3] See U.S. Department of Transportation, Bureau of Transportation Statistics, “TSI and the Economy Revisited,” December 2014, available at https://www.bts.gov/archive/publications/special_reports_and_issue_brie….
[4] See U.S. Department of Transportation, Bureau of Transportation Statistics, “Long Term Growth in Freight Transportation Services: Methods and Findings,” available at https://www.bts.gov/topics/transportation-and-economy/long-term-growth-… as of June 2019.
[5] https://www.spglobal.com/spdji/en/indices/equity/dow-jones-transportation-average/#overview
[6] https://www.cassinfo.com/freight-audit-payment/cass-transportation-indexes/cass-freight-index