Long-Term Growth in Freight Transportation Services
Long-Term Growth in Freight Transportation Services: Methods and Findings
The economic recovery following the Great Recession through the end of 2016 was slow but steady. That same pattern was evident in transportation services where the Transportation Services Index (TSI), which comprises both passenger and freight indexes, once again rose above the long-term growth trend, suggesting that TSI continues to broadly mirror growth in the economy. The freight TSI began to rise quickly after turning in May 2009 (one month ahead of the economic acceleration following the recession) but has since slowed. Rail ton miles and truck tonnage have not regained their earlier growth rate. This failure to regain the pace of pre-recession growth is more dramatic for rail traffic than it is for truck tonnage. The purpose of this paper is to explain the method for estimating growth in the TSI above the long-term trend and to show in detail how that growth changed from the period before the recession to afterwards.
Long-Term Growth in Freight Transportation Services
Freight transportation services declined 13.2 percent during the Great Recession (December 2007 – June 2009), as measured by the Transportation Services Index (TSI—see box A) . Gross domestic product (GDP), in comparison, declined by 4.4 percent during the recession. The Freight Transportation Services Index (TSIf) began to rise quickly after turning in May 2009 (one month ahead of the economic acceleration following the recession) but then slowed. The recession was preceded by extended growth periods outpacing the long-term trend (measured using seasonal adjustment, trending, and smoothing, as discussed below) in freight transportation services. After the recession, freight transportation services rose above the long-term growth trend, although through the end of 2016 growth lagged behind the pre-recession level. The pace of GDP growth of 2.1 percent after the recession through 2016 matched the rate of 2.0 percent before the recession.
This paper explains the method for estimating deviations from long-term growth in freight transportation services and shows how that growth changed before and after the recession. Short-term growth in freight transportation services appears after detrending and smoothing the seasonally adjusted Freight TSI series. The use of statistical tools, including detrending (removing the long-term growth trend) and smoothing (using an algorithm to remove noise from the TSIf, revealing important patterns) allows the identification of times when the TSIf changed from increasing to decreasing (or vice versa). These turning points are used to identify periods of growth or slowdown. Previous BTS research shows that changes in the TSIf occur before changes in the overall economy, making the TSIf a potentially useful leading economic indicator. This paper adds to that research by examining the growth before and after the recession. The paper also examines trends in the truck and rail data, the major components of the TSIf.
BOX A: Transportation Services Index (TSI)
The Transportation Services Index (TSI), produced by the U.S. Department of Transportation, Bureau of Transportation Statistics (BTS), measures the number of people and volume of goods (passenger-miles and ton-miles) moved by for-hire transportation. BTS produces three indexes – a freight index, a passenger index, and a total or combined index. The indexes combine monthly data from multiple for-hire transportation modes. Each index shows the month-to-month change in the quantity of for-hire transportation services provided. Monthly data on each mode of transportation is seasonally adjusted and then combined into the three indexes. The freight index is a weighted average of data for trucking, freight rail, waterborne, pipeline, and air freight. The passenger index is a weighted average of data for passenger aviation, transit, and passenger rail. The combined index is a weighted average of all these modes. These indexes serve both as multimodal monthly measures of the state of transportation and as indicators of the U.S. economic future.
Methodology
BTS uses several steps to determine TSIf trends and turning points. First, the regular seasonal variation in activity, such as the annual freight ramp-up before the holiday season, was removed. The seasonally adjusted data were then detrended to remove the long-term trend in the data and to show short-term trends. Finally, the detrended data were smoothed to remove the noise that can obscure short-term trends and turning points.
Seasonal Adjustment
BTS seasonally adjusts the raw TSIf data by mode. TSIf data are highly seasonal, due to regular seasonal variation in the transportation volume associated with weather, the retail inventory buildup prior to the holiday season, and other recurring changes. Real month-to-month changes in transportation can be masked by normal seasonal fluctuations. Seasonal adjustment is done with X12-ARIMA software developed by the U.S. Census Bureau. ARIMA (Autoregressive Integrated Moving Average) allows month-to-month and year-to-year trend comparisons.1 Three seasonally adjusted Transportation Services Indexes are published monthly by BTS to show the month-to-month changes in the magnitude (passenger-miles and ton-miles, weighted by mode) of freight, passenger, and total transportation separately.
Detrending
The seasonally adjusted data are detrended to make cycles and turning points more visible. The TSIf time series data show strong long-term trends, due to the decades of transportation growth. These trends can mask shorter term upturns and downturns in transportation. The Hodrick-Prescott (HP) filter is applied to the seasonally adjusted data to detrend it and to observe the underlying cycles more easily. HP filters with an alpha of 108,000 as suggested by Zarnowitz and Ozyildirim [2001]2 and by Lahiri et al. [2003]3,4 are used. The alpha value determines the smoothness of the data. A larger alpha will result in smoother data. Alpha of 108,000 has been shown in the research to reasonably smooth the data while minimizing distortions to the data. Detrended values above zero represent times when the TSIf grew faster than its long-term trend. Levels below zero represent declines, or slowdowns below TSIf’s long-term rate of growth. Faster growth in the TSIf is caused by increases in sales and production, shifts in inventories, and other changes in the broader economy that drive transportation.
Smoothing
TSIf data has substantial month-to-month volatility after detrending. Volatility in TSIf represents relatively dramatic month-to-month changes unrelated to trends. These changes can be caused by unseasonable weather, spikes in the movement of particular commodities, or data issues. This volatility can mask trends in TSIf. The detrended data are smoothed using a 12-month centered moving average.5 Smoothing of the detrended values removes month-to-month volatility and makes it easier to see the growth in the TSIf since the end of the recession.
Long Term Growth in Freight Transportation Services: Methods and Findings
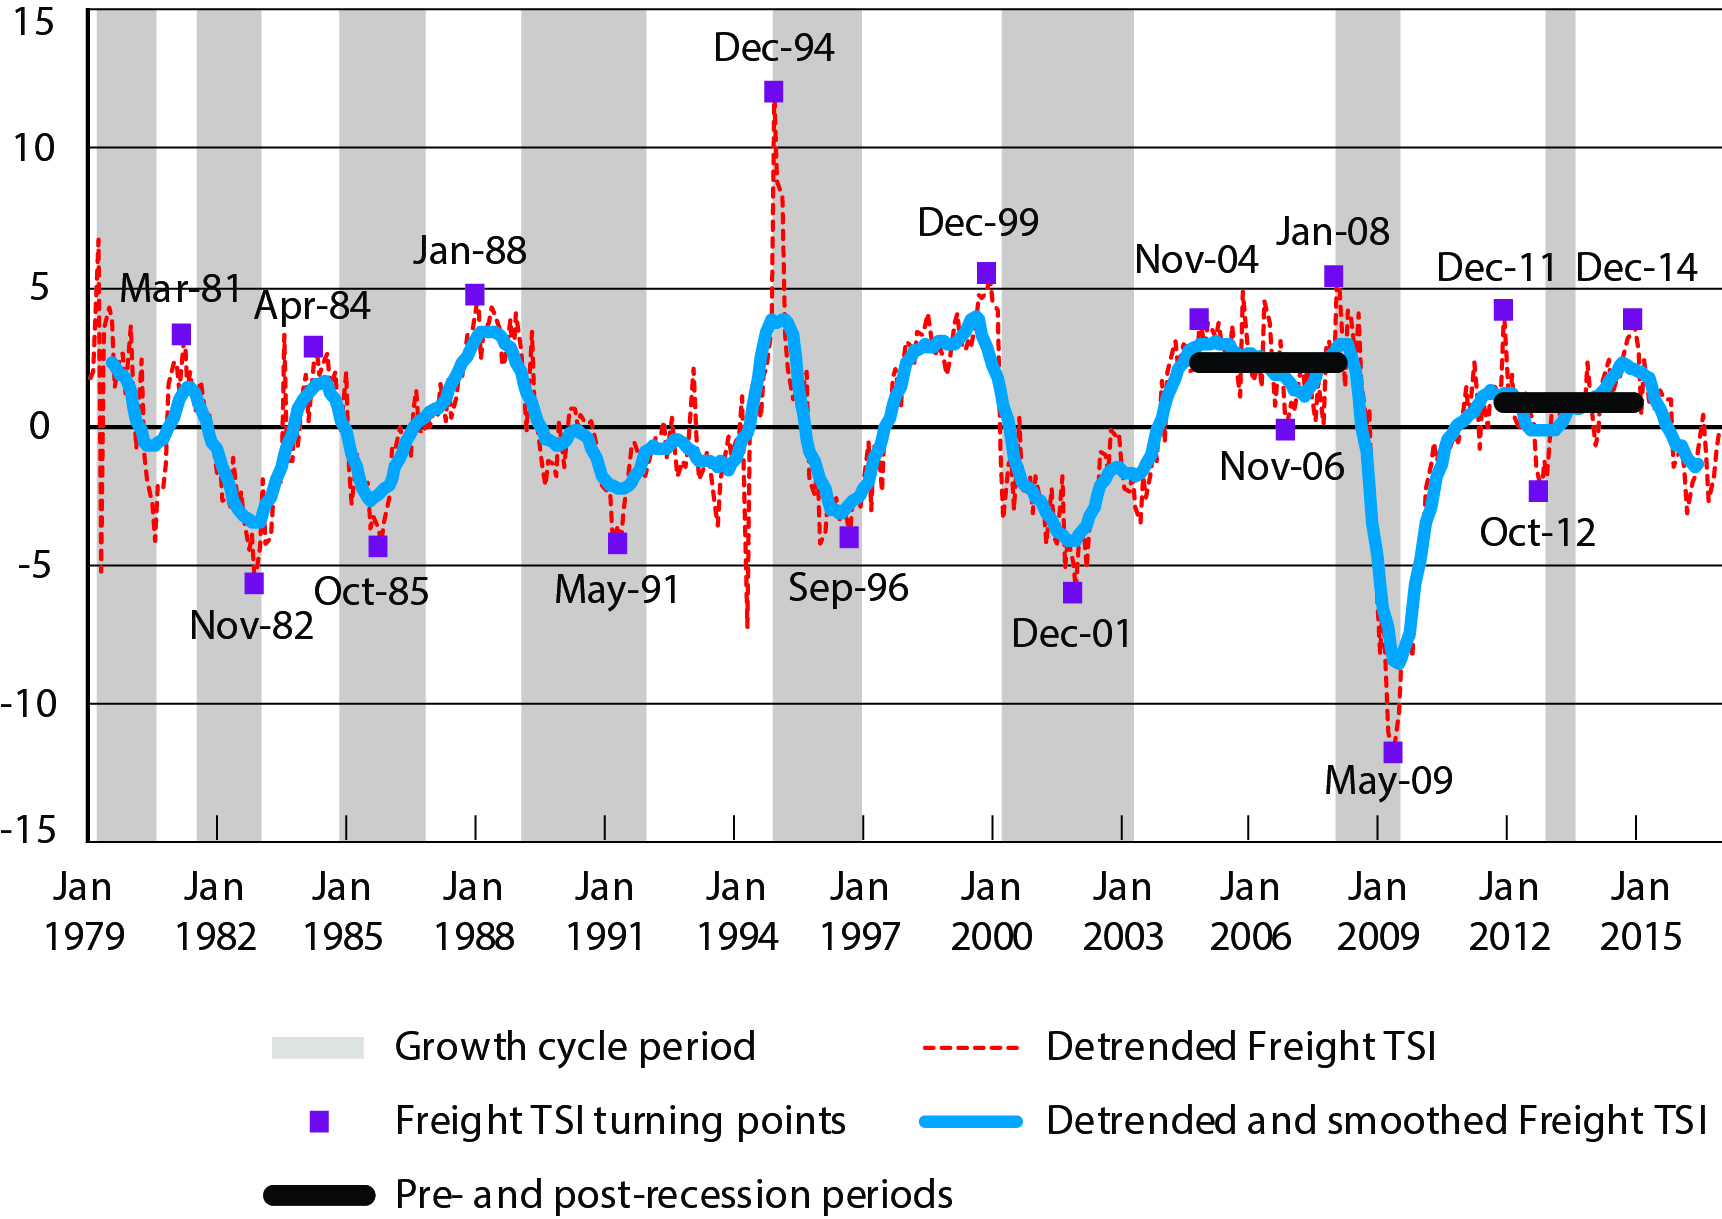
Figure 1 shows the detrended and smoothed TSIf between January 1979 and December 2016. The dotted red line in figure 1 represents the detrended TSIf with turning points denoted by squares.6 The solid blue line represents the detrended and smoothed TSIf. The horizontal line at zero represents where TSIf would be if it grew consistently, in keeping with its long-term trend. The thick black lines represent the average levels relative to the long-term trend of TSIf for two key periods— the 39 months from the November 2004 peak to the January 2008 peak (pre-recession) and the 37 months from the December 2011 peak to the December 2014 peak (post-recession). The exact beginning and end dates were selected to create peak-to-peak periods for an easier comparison of phases of succeeding cycles. The vertical grey bars represent downturns in the economic growth cycle.7
Figure 1. Detrended and Smoothed Freight TSIf (January 1979 to December 2016)

NOTE: Shaded areas indicate decelerations in the economy’s growth cycles. Black lines represent the average levels relative to the long-term trend for two key periods. Purple boxes represent turning points.
The TSIf began to rise quickly after turning in May 2009 (one month ahead of the economic acceleration following the recession) but has since slowed. Growth in the last few years since the recession has fallen short of pre-recession growth, as shown by the detrended and smoothed values of the TSIf. The detrended and smoothed values have risen only slightly above zero since the recession. The average detrended and smoothed value from December 2011 to December 2014 (0.85) has fallen short of the average peak-to-peak value from November 2004 through January 2008 prior to the recession (2.28), indicating a slower pace of growth in freight transportation since the recession. The absolute value of TSIf matched its pre-recession high of 113.7 (first reached in November 2005) in December 2011.
This trend contrasts with the pattern of GDP, which grew just as rapidly from December 2011 to December 2014 (a compound annual growth rate of 2.1 percent) as it did from November 2004 to January 2008 (a compound annual growth rate of 2.0 percent). The recent GDP growth rate is slow compared to historical growth of about 3 percent since 1975) The varying trends suggest that freight transportation has recovered more slowly than the economy as a whole. This difference may be explained in part by the slow post-recession growth in manufacturing, an important source of demand for freight transportation (1.9 percent from December 2011 to December 2014, compared to 4.9 percent from November 2004 to January 2008). Another important source of demand for freight transportation, retail sales, also grew somewhat slower after the recession (1.8 percent from December 2011 to December 2014, compared to 2.2 percent from November 2004 to January 2008).
Truck Tonnage and Growth Cycles: January 1979–December 2016
The TSIf is constructed using data on freight shipments by truck, railroad, air, inland water, and pipeline. The following sections examine the two largest modal components of TSIf , trucking and rail.
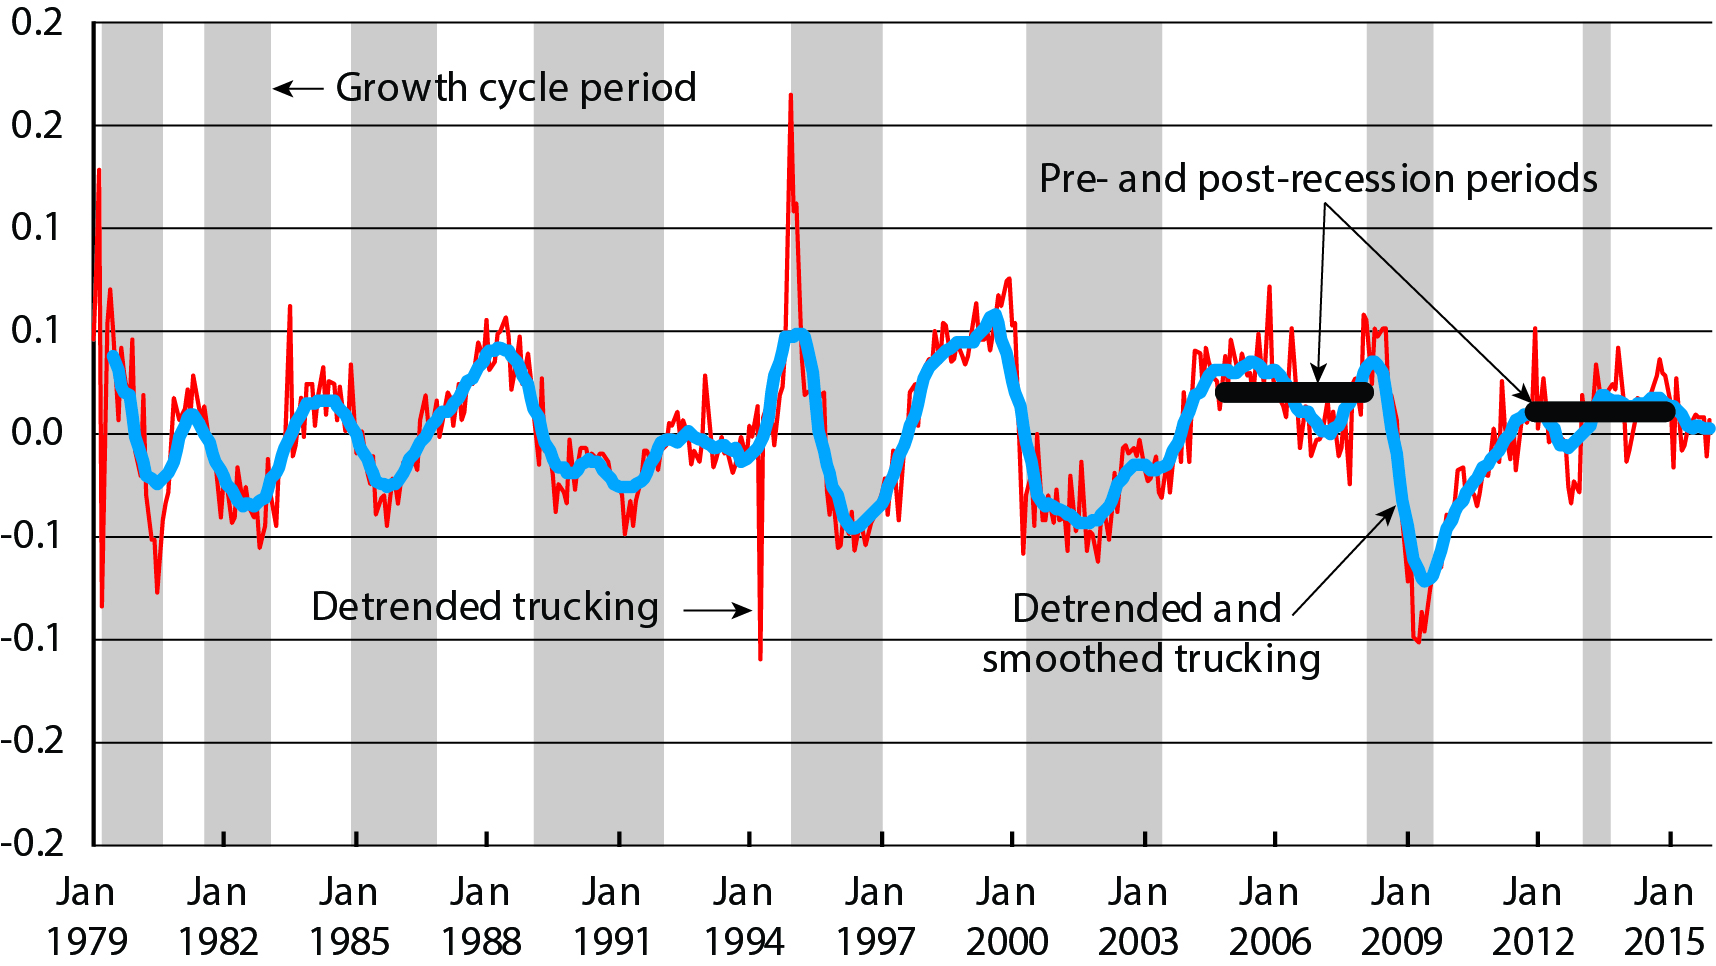
Figure 2 shows the change in growth levels for truck tonnage,8 the largest component of TSIf.
Figure 2. Detrended and Smoothed Truck Tonnage (January 1979 to December 2016)

NOTE: Shaded areas indicate decelerations in the economy (growth cycles).
Truck tonnage grew above its long-term trend prior to the recession (0.02). Following the recession, from December 2011 to December 2014, its growth was closer (0.011) to the average long-term growth rate. As in the case of the overall TSIf , truck tonnage has not regained its earlier pace of growth, possibly due to the slow growth in manufacturing since the recession ended.
Rail Traffic and Growth Cycles: January 1979–December 2016
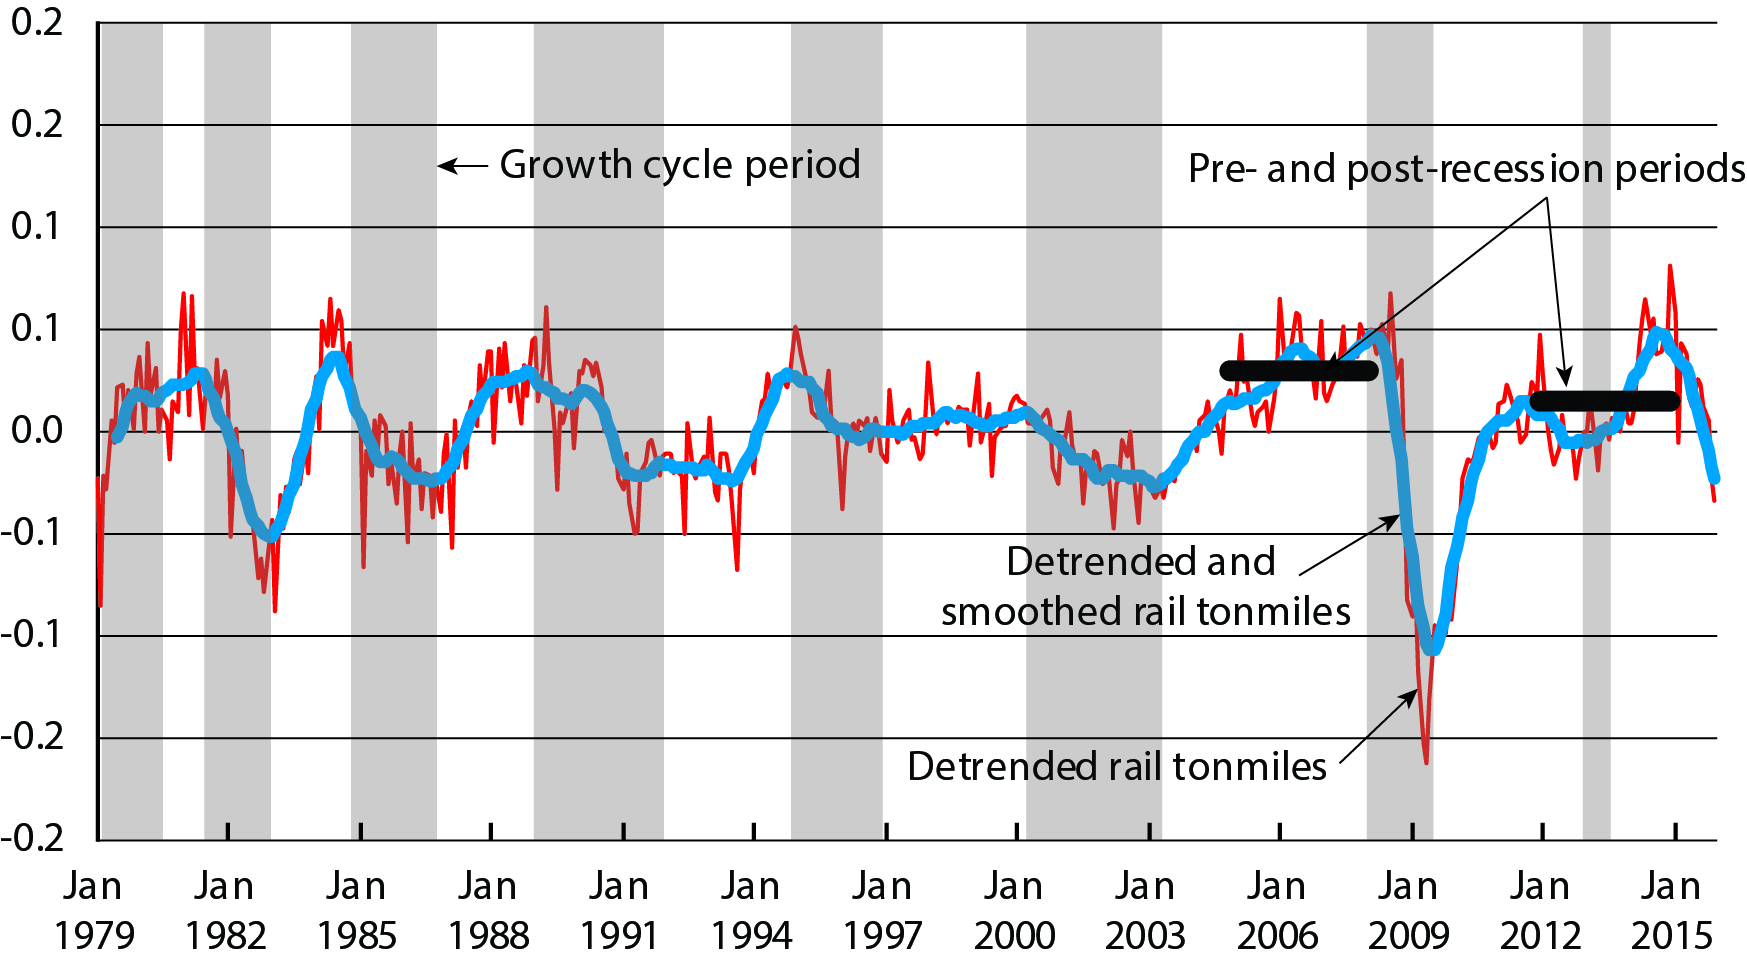
Figure 3 shows the change in growth levels for rail traffic,9 the second largest component of TSIf.
Figure 3. Detrended and Smoothed Rail Traffic (January 1979 to December 2016)

NOTE: Shaded areas indicate decelerations in the economy (growth cycles).
Rail tonnage grew above its long-term trend prior to the recession (0.03). Following the recession, from December 2011 to December 2014, growth was closer (0.01) to the average long-term growth rate for rail tonnage. As in the case of the overall TSIf, rail ton miles traffic has not regained the earlier pace of growth, possibly due to the slow growth in manufacturing since the recession. This failure to regain the pre-recession growth is more dramatic for rail traffic than it is for truck tonnage.
Conclusion
The Great Recession from December 2007 to June 2009 separated two distinct periods in the growth of freight transportation services. TSIf grew well above (2.28 index points) the long-term trend from November 2004 to January 2008. Post-recession growth through 2016 exceeded the long-term trend but less significantly (by only 0.85 index points). The truck and rail modes, which are the largest components of TSIf, show similar patterns, though the pattern is more dramatic for rail than for truck. The TSIf growth rate has been above the long-term trend following the recession but has not returned to the fast-paced growth prior to the recession. The transportation trend contrasted with GDP, which had post-recession growth that matched pre-recession growth.
1 More information on the Seasonal Adjustment process, and how BTS uses it, can be found at https://www.bts.dot.gov/explore-topics-and-geography/topics/seasonally-adjusted-transportation-data
2 Zarnowitz, V. and A. Ozyildirim. 2001. Time Series Decomposition and Measurement of Business Cycles, Trends and Growth Cycles, Economics Program Working Paper #01-04. New York, NY: The Conference Board.
3 Lahiri, K., H. Stekler, W. Yao and P. Young. 2003. Monthly Output for the U.S. Transportation Sector. Journal of Transportation and Statistics 6(2/3), 1-28.
4 Transportation Services Index and the Economy-Revisited December 2014, BTS https://www.bts.gov/archive/publications/special_reports_and_issue_briefs/special_report/2014_12_10/entire
5 Smoothing with a 12 month centered moving average is a step in the Bry and Boschan (1971) procedure for determining turning points in an economic series, which is described further in Transportation Services Index and the Economy-Revisited December 2014, BTS https://www.bts.gov/archive/publications/special_reports_and_issue_briefs/special_report/2014_12_10/entire
6 Turning points are determined using the Bry and Boschan proceduce documented in Transportation Services Index and the Economy-Revisited December 2014, BTS https://www.bts.gov/archive/publications/special_reports_and_issue_briefs/special_report/2014_12_10/entire
7 An explanation of growth cycles and their relationship to recessions and the business cycle, can be found in Transportation Services Index and the Economy-Revisited December 2014, BTS https://www.bts.gov/archive/publications/special_reports_and_issue_briefs/special_report/2014_12_10/entire
8 The source for the truck tonnage data used in TSIf is the monthly truck tonnange index issued by the American Trucking Assotiations.
9 Rail traffic for the period from 2000 on is based on monthly rail carloads and intermodal units as reported by the Association of American Railroads, which is used for monthly production of TSI. Historical data prior to 2000, for which monthly carloads and intermodal units were not available, are based on quarterly ton miles data. This change does not impact the results of this paper.
