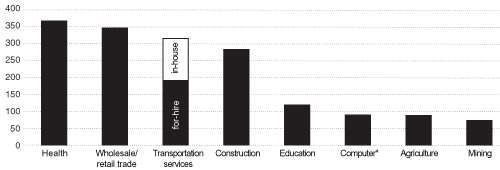
Figure 1 Value-Added by Selected Industry Sectors:1992
Figure 1
Value-Added by Selected Industry Sectors:1992
($billions)

Truck shipments for Alaska and Hawaii are each about half the size of South Dakotas.
NOTE: The size of each circle represents shipments by truck from manufacturing, mining, farming, and wholesale establishments. Imports, shipments crossing the U.S. en route between foreign origins and destinations, and shipments by service industries, governments, and households are excluded. Shipments from, to, and within each state are compiled from the 1993 Commodity Flow Survey, adjusted by Oak Ridge National Laboratory to include farm-based shipments in the 1992 Census of Agriculture. Oak Ridge estimated through shipments by assigning flows to most likely routes on the National Highway Planning Network.
SOURCE: U.S. Department of Transportation, Bureau of Transportation Statistics, May 5, 1997.
