
Average Age of Urban Transit Vehicles
Figure
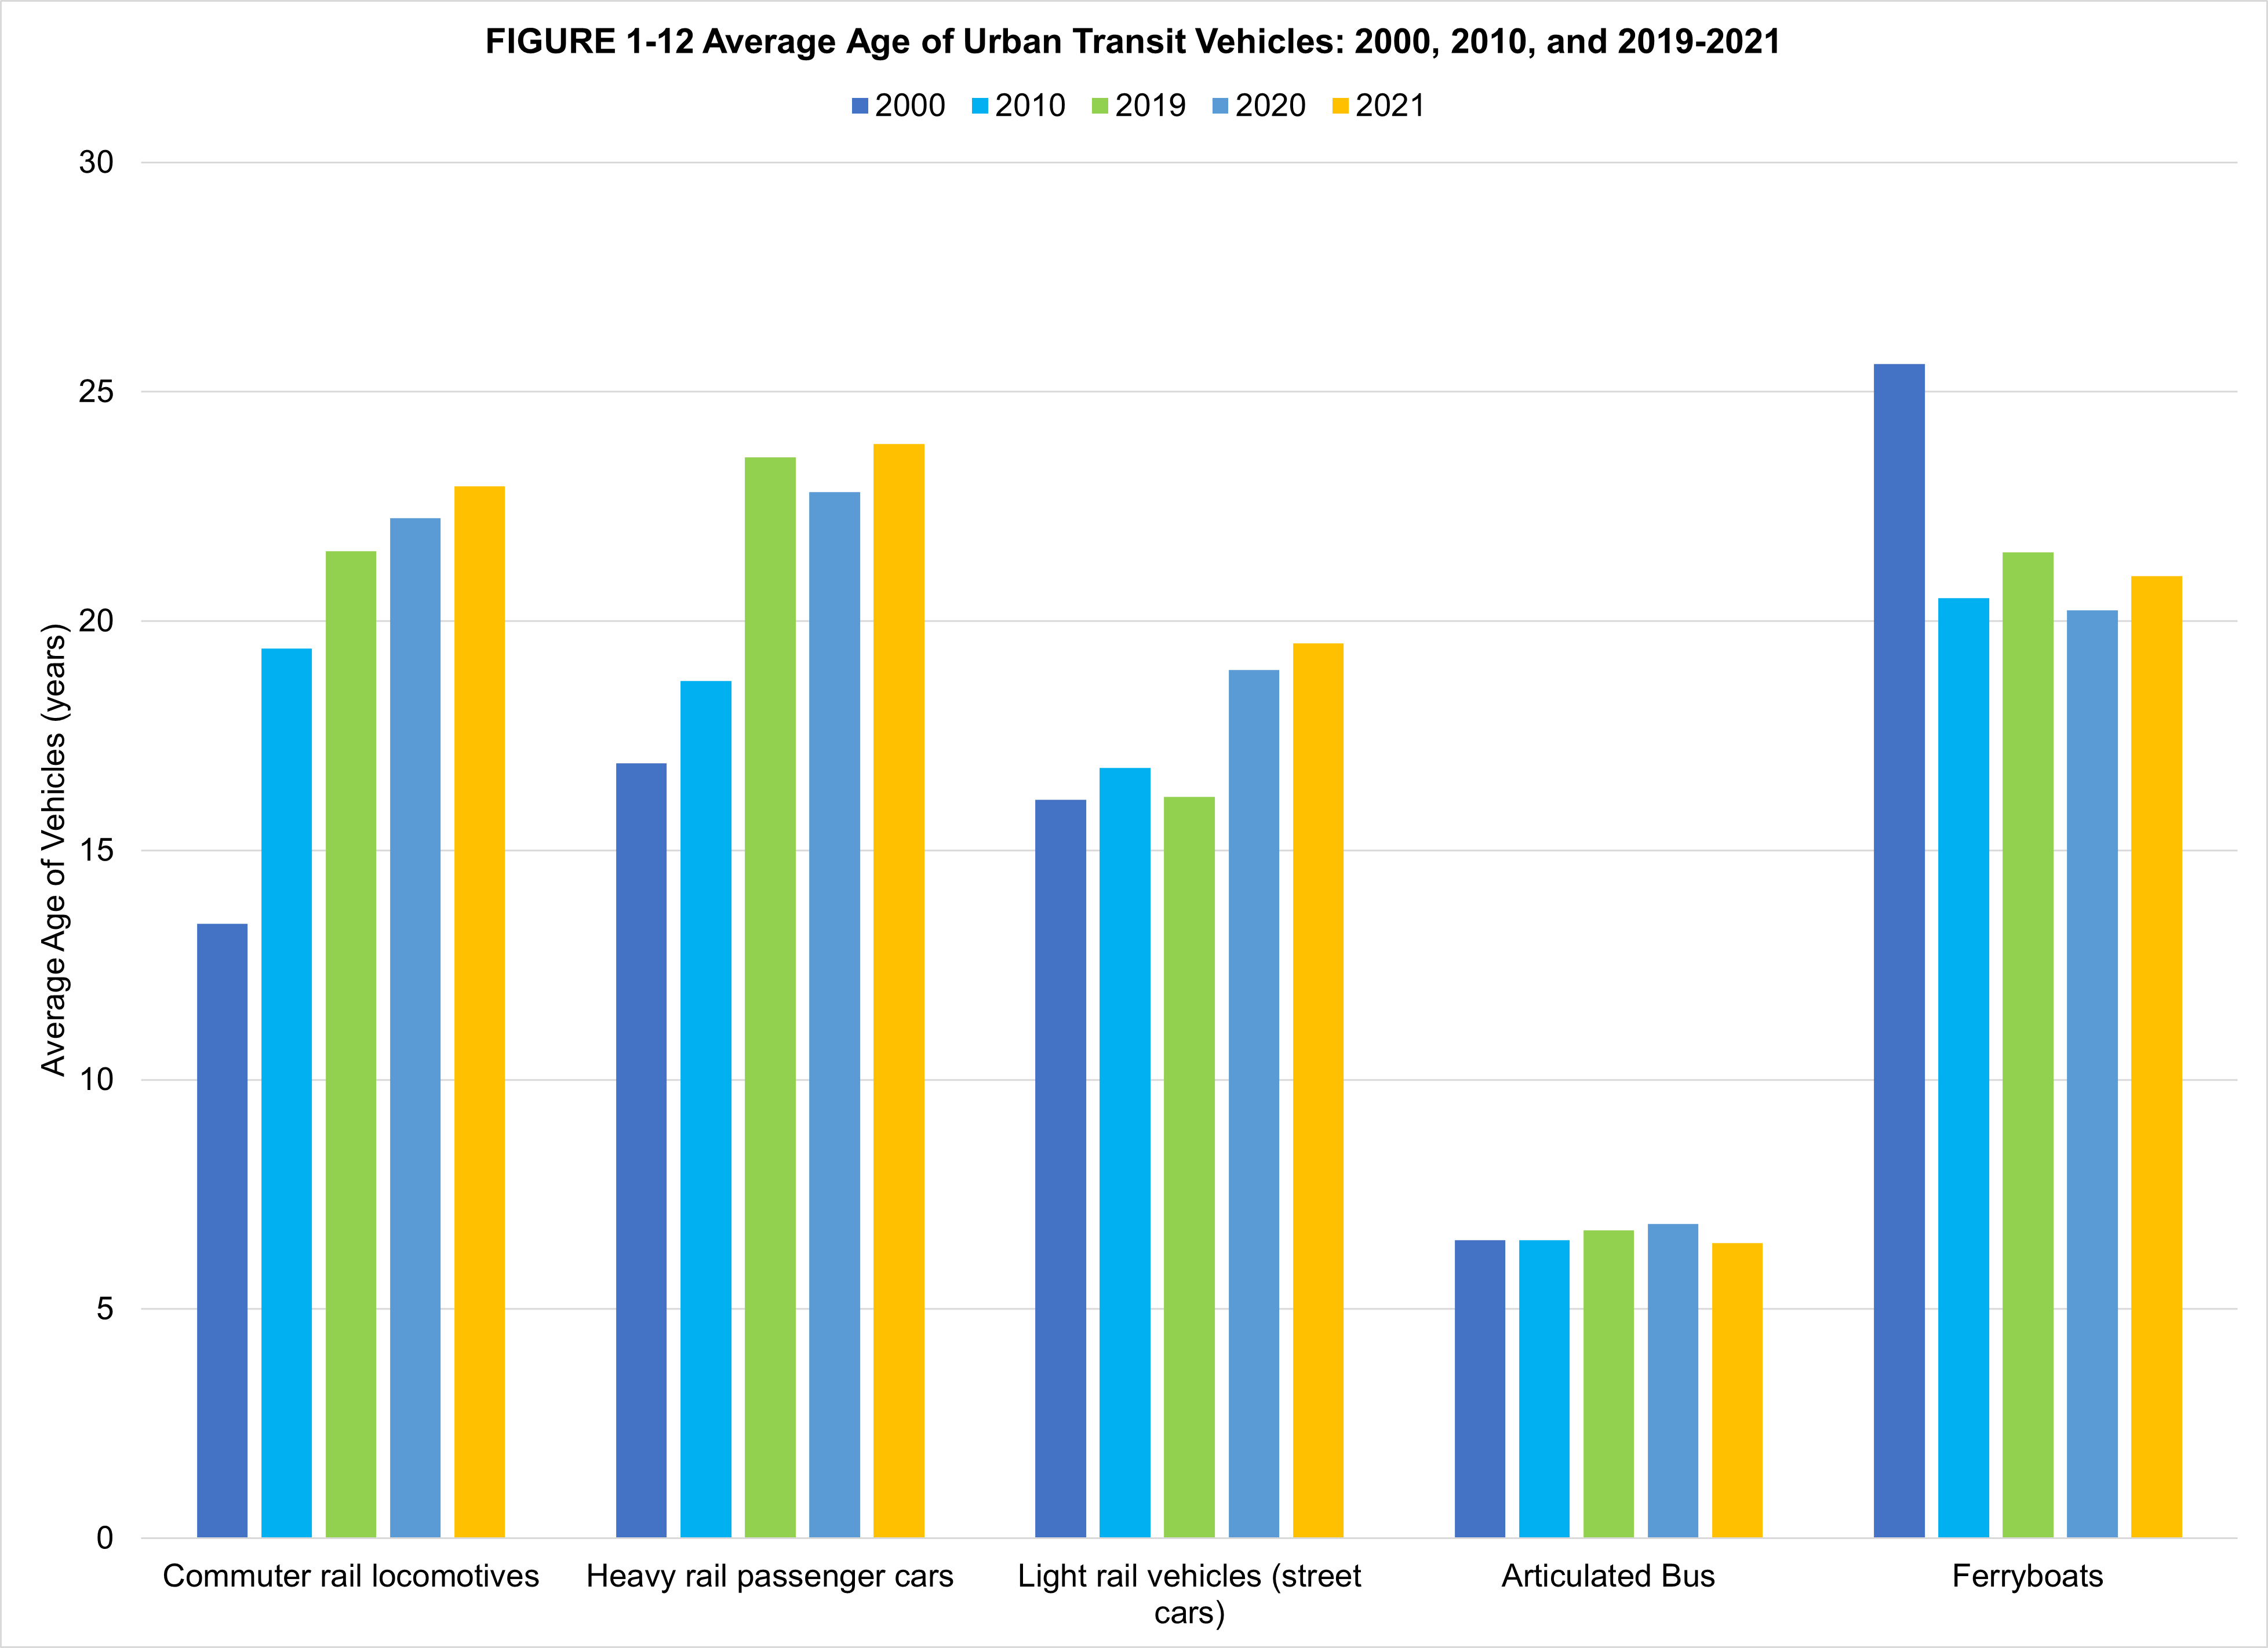
Dataset Table:
| 2000 | 2010 | 2017 | 2018 | 2019 | 2020 | 2021 | |
|---|---|---|---|---|---|---|---|
| Commuter rail locomotives | 13.4 | 19.4 | 20.0 | 20.7 | 21.5 | 22.2 | 22.9 |
| Heavy rail passenger cars | 16.9 | 18.7 | 23.0 | 23.4 | 23.6 | 22.8 | 23.9 |
| Light rail vehicles (street cars) | 16.1 | 16.8 | 18.5 | 16.9 | 16.2 | 18.9 | 19.5 |
| Articulated Bus | 6.5 | 6.5 | 7.3 | 6.9 | 6.7 | 6.9 | 6.4 |
| Ferryboats | 25.6 | 20.5 | 22.3 | 21.7 | 21.5 | 20.2 | 21.0 |
Dataset Excel:
F1-12 Average Age of Urban Transit Vehicles.xlsx (23.97 KB)Source:
U.S. Department of Transportation, Federal Transit Administration, Vehicles, available at www.transit.dot.gov/ntd/ntd-data as of September 2023; as reported in U.S. Department of Transportation, Bureau of Transportation Statistics, National Transportation Statistics, Table 1-29, available at www.bts.gov as of September 2023.
Publications: