
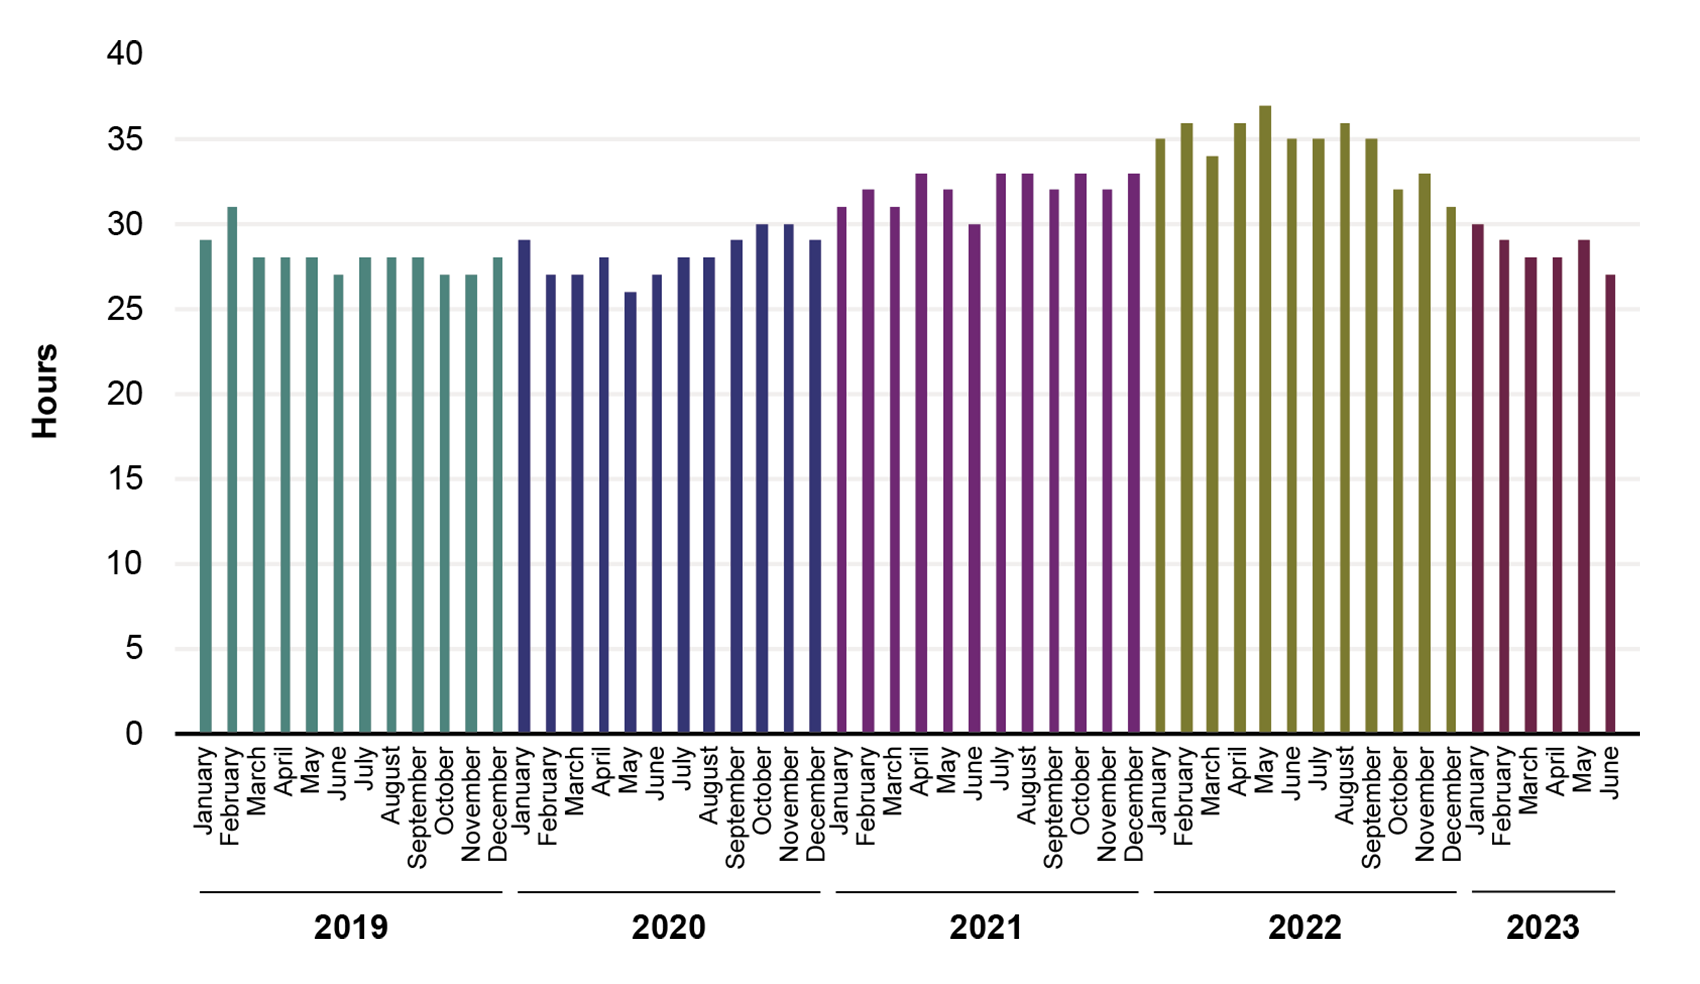
Average Container Vessel Dwell Time for Top 25 U.S. Container Ports: 2019–June 2023
Figure
Dataset Excel:
T3-09 Average Railroad System-wide Annual Dwell Time Hours.xlsx (17.37 KB)Notes:
Vessel calls of less than 4 hours or more than 120 hours were excluded as representing calls either too short for significant cargo handling or too long for normal operations. The Top 25 container ports are based on 2018, 2019, and 2020 port rankings published by the U.S. Army Corps of Engineers, Waterborne Commerce Statistics Center.
Description:
This graph is from the 2024 Transportation Statistics Annual Report.
Source:
U.S. Department of Transportation, Bureau of Transportation Statistics, calculated using AIS data from the U.S. Coast Guard’s Nationwide Automatic Identification System (NAIS) archive, processed by the U.S. Army Engineer Research and Development Center, Coastal and Hydraulics Laboratory, through the AIS Analysis Package (AISAP) software application, as of August 2024.