USA Banner

Official US Government Icon

Official websites use .gov
A .gov website belongs to an official government organization in the United States.

Secure Site Icon

Secure .gov websites use HTTPS
A lock ( ) or https:// means you’ve safely connected to the .gov website. Share sensitive information only on official, secure websites.

U.S. Department of Transportation U.S. Department of Transportation Icon United States Department of Transportation United States Department of Transportation

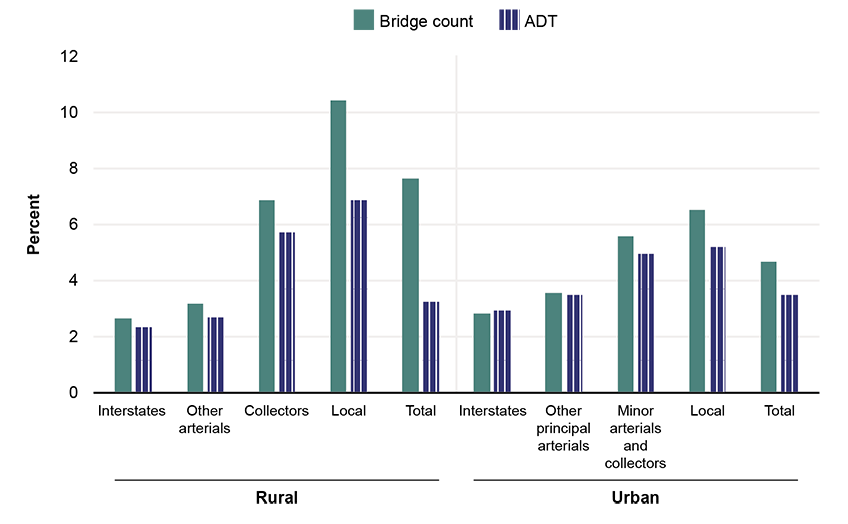
Bridges in Poor Condition and Avg Daily Traffic on Bridges 2024

Key: ADT = Average Daily Traffic

Figure

The bar graph shows the percent of bridges in poor condition and the percentage of average daily traffic on bridges. The road types shown include rural interstates, other arterials, collectors, local, and the total and urban interstates, other principal arterials, minor arterials and collectors, local, and the total. Local roads have the highest percentage of bridges in poor condition for both rural (10 percent) and urban (6 percent) roads. Overall, rural roads have a higher percentage of bridges in poor co

Notes:

A “poor” bridge condition rating is determined by the lowest rating of the National Bridge Inventory condition ratings for bridge deck, superstructure, substructure, or culverts. Roads are usually classified by the volumes carried and travel speeds designed for. Thus, interstate highways are considered the highest functional classification whereas local streets are considered the lowest.

Description:

This graph is from the 2024 Transportation Statistics Annual Report.

Source:

U.S. Department of Transportation, Federal Highway Administration, Bridge Condition by Functional Classification, available at https://www.fhwa.dot.gov/bridge/fc.cfm as of August 2024.

Publications: