USA Banner

Official US Government Icon

Official websites use .gov
A .gov website belongs to an official government organization in the United States.

Secure Site Icon

Secure .gov websites use HTTPS
A lock ( ) or https:// means you’ve safely connected to the .gov website. Share sensitive information only on official, secure websites.

U.S. Department of Transportation U.S. Department of Transportation Icon United States Department of Transportation United States Department of Transportation

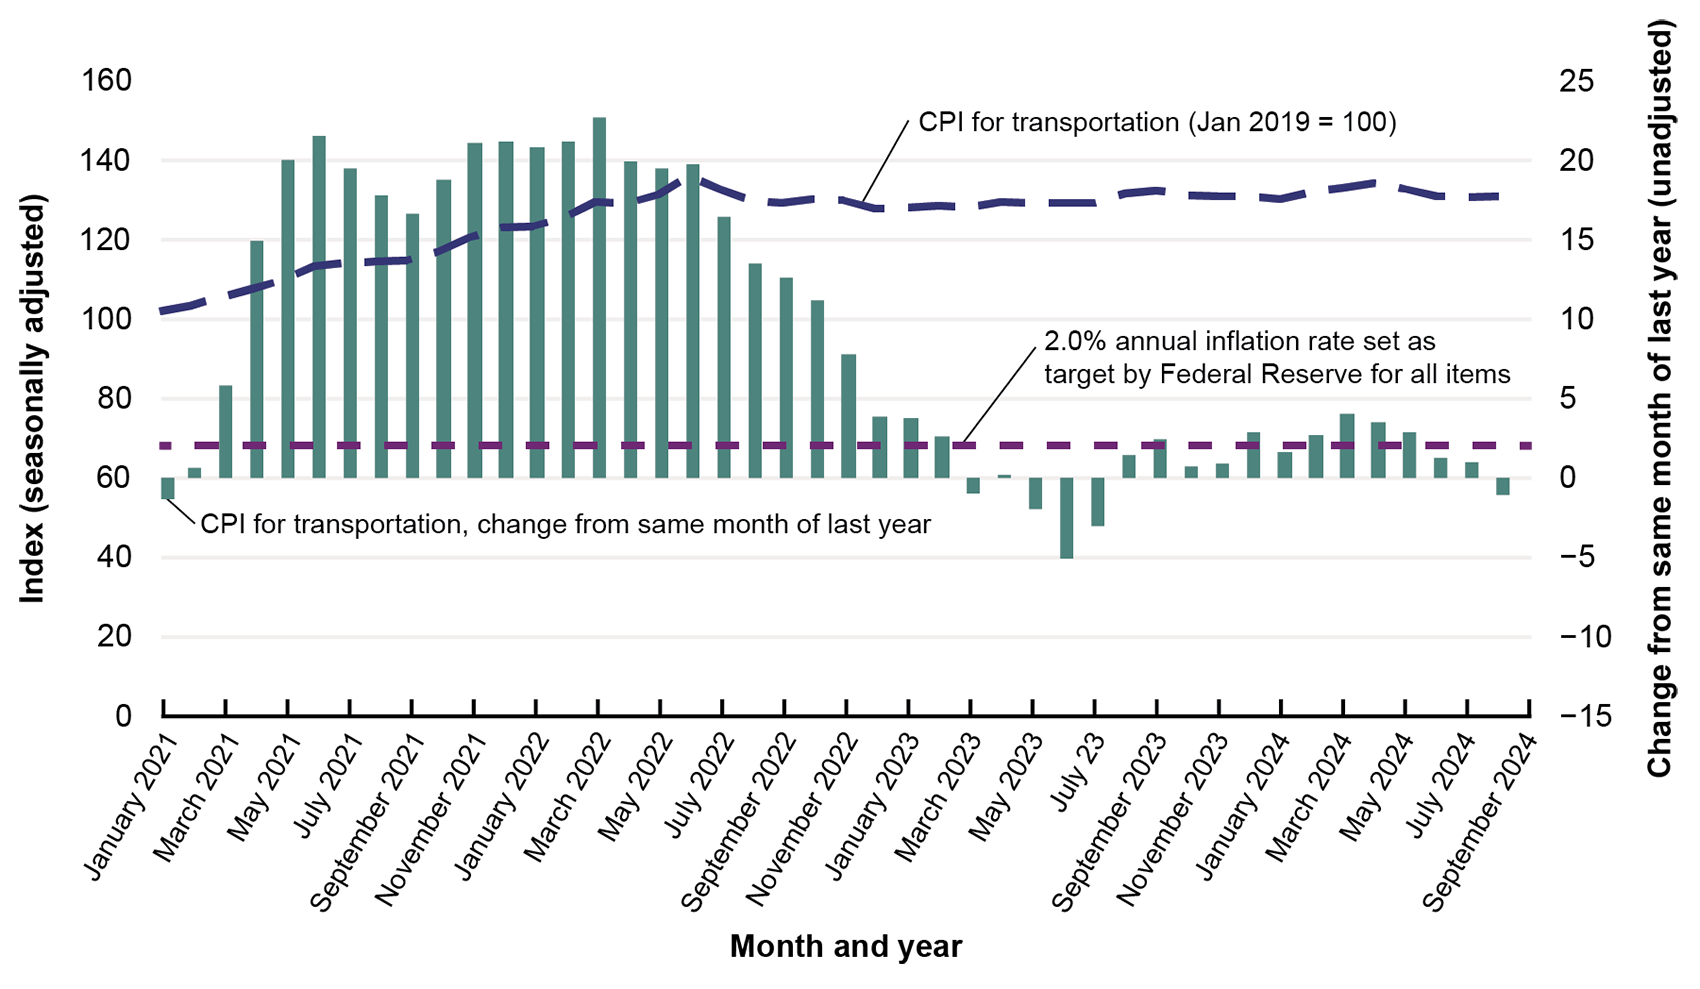
Consumer Price Index for Transportation, Change from Same Month of the Previous Year and Seasonally Adjusted Value: January 2021–August 2024

Figure

This bar graph shows the consumer price index (CPI) for transportation and the change in CPI for transportation from the previous year. Year-over-year prices increased between March 2021 to February 2023 and between August 2023 to July 2024.

Dataset Excel:

F4_20_CPI_year_over_year.xlsx (1.24 MB)

Description:

This bar chart is from the 2024 Transportation Statistics Annual Report.

Source:

Calculated by the U.S. Department of Transportation from the U.S. Department of Labor, Bureau of Labor Statistics, Consumer Price Index, All Urban Consumers, U.S. City Average, seasonally adjusted (CUSR0000SAT) and unadjusted (CUUR0000SAT), available at www.bls.gov/cpi as of September 2024.

Publications: