
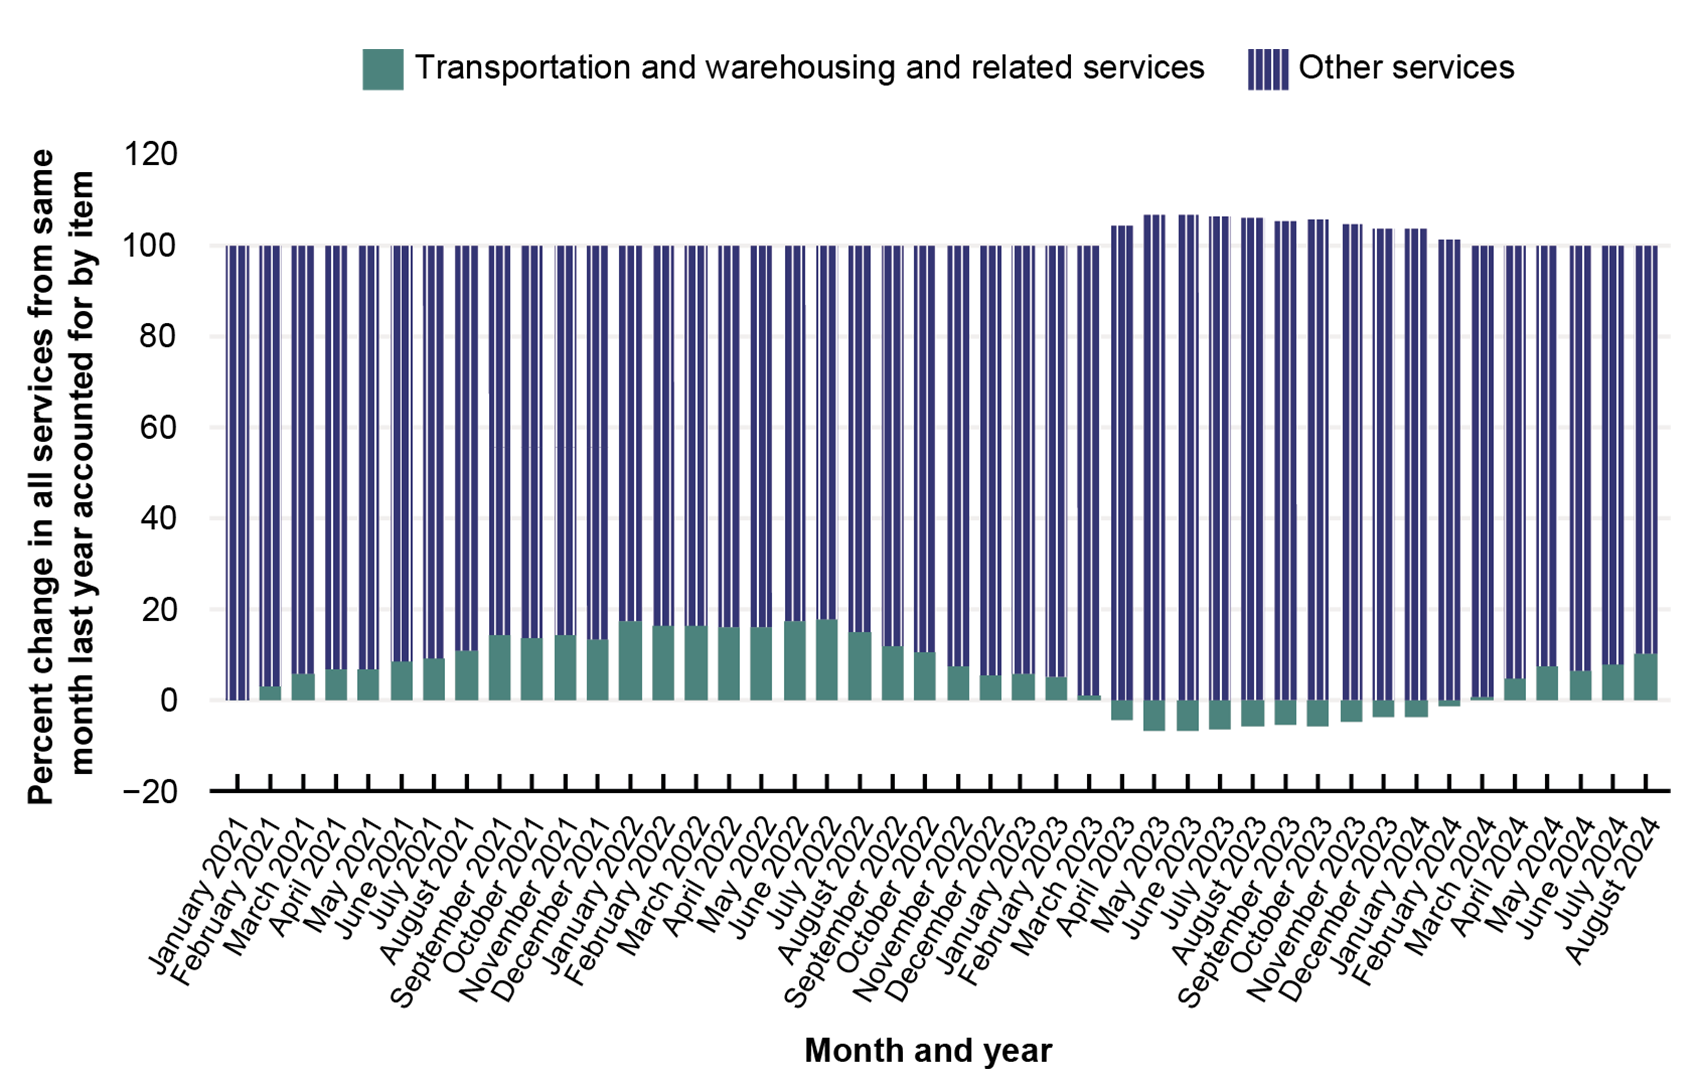
Contribution of Transportation and Related Services to Inflation Faced by Producers of Goods and Services: January 2021–August 2024
Figure
Dataset Excel:
F4_24_PPI_Contribution.xlsx (1.18 MB)Notes:
Data include air transportation of freight, airline passenger services, rail transportation of freight and mail, rail transportation of passengers, truck transportation of freight, courier and messenger services (except air), U.S. postal service, arrangement of freight and cargo, marine cargo handling, operation of port waterfront terminals, airport operations (excluding aircraft maintenance and repair), towing, tugging, docking, and related services, freight forwarding, warehousing, storage, and related services purchased by industries to produce output.
Description:
This bar chart is from the 2024 Transportation Statistics Annual Report.
Source:
U.S. Department of Transportation, Bureau of Transportation Statistics’ calculations from U.S. Department of Labor, Bureau of Labor Statistics, Producer Price Index (Current Series), Unadjusted WPU301601, WPU301602, WPU3021, WPU3022, WPU3011, WPU3012, WPUFD42, WPU3131, WPU3132, WPU3211, WPU3111, WPU3112, WPU3113, and WPU3121, available at https://www.bls.gov/ppi/data.htm as of September 2024.