
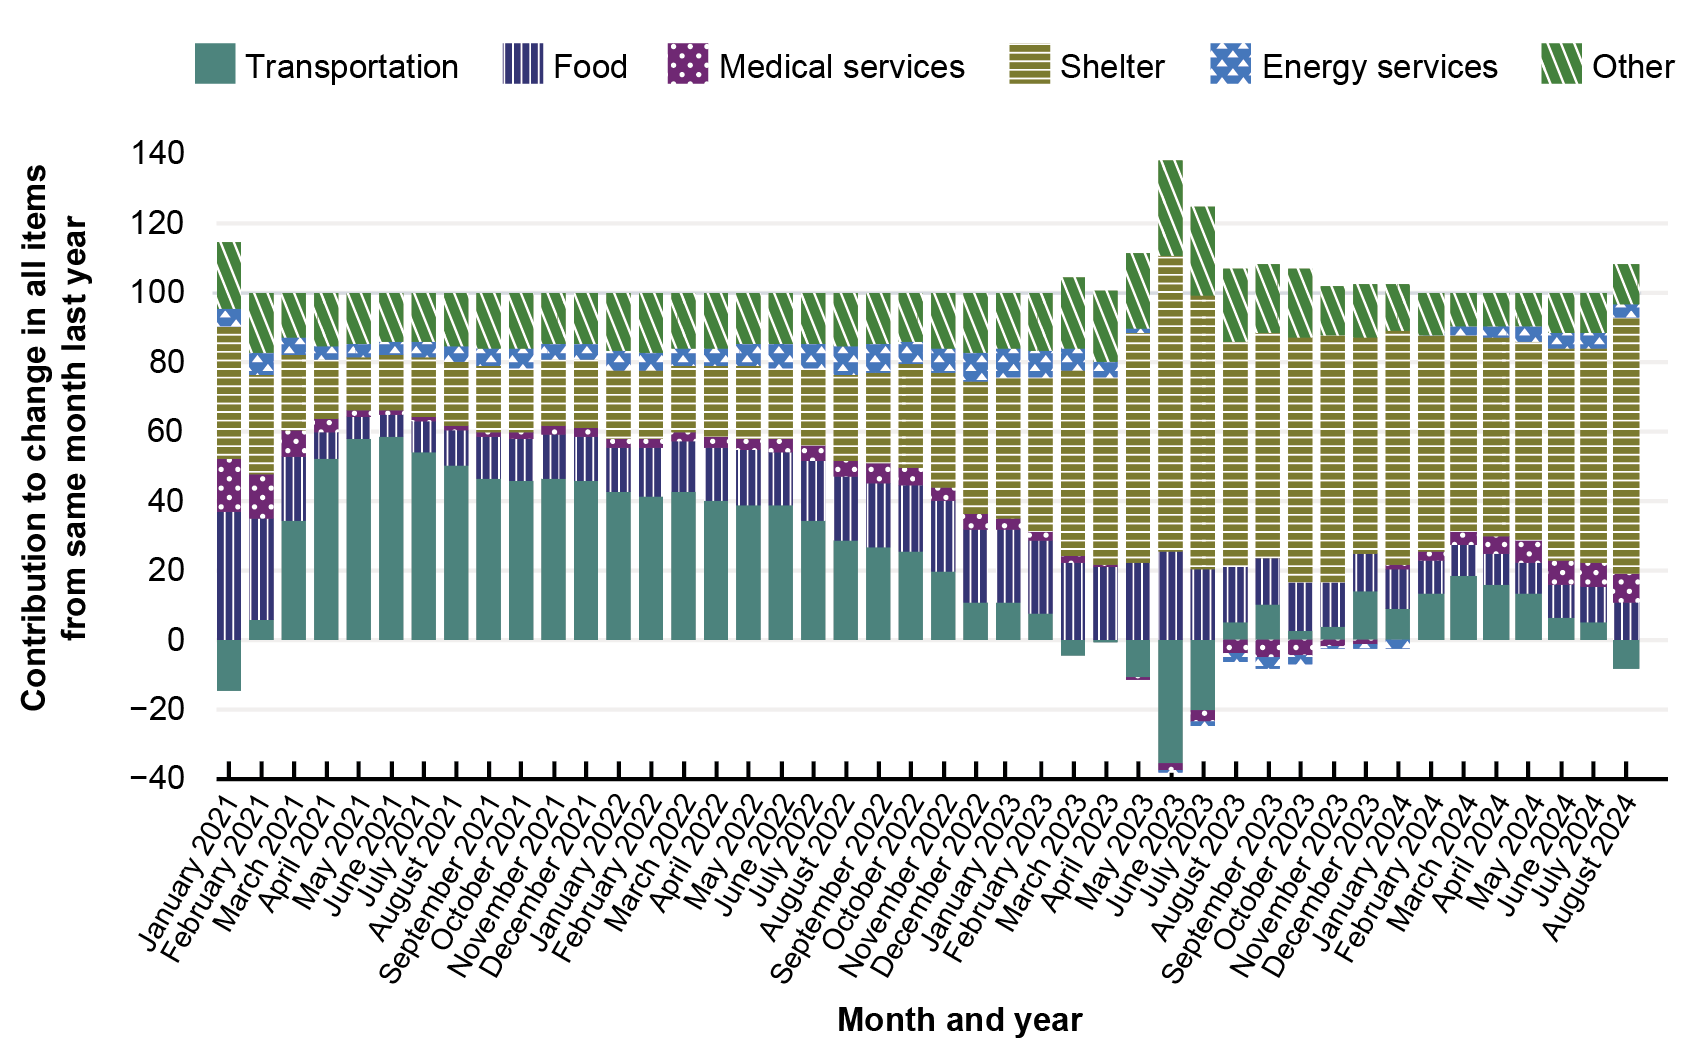
Contribution of Transportation to Inflation Compared to Food, Shelter, and Medical Services: January 2021–August 2024
Figure
Dataset Excel:
F4_19_CPI_Inflation.xlsx (1.22 MB)Notes:
Energy services are services such as electricity and utility (gas) piped service.
Description:
This bar chart is from the 2024 Transportation Statistics Annual Report.
Source:
U.S. Department of Labor, Bureau of Labor Statistics, All Urban Consumers (Current Series), Unadjusted, US City Average, news release table 7, available at https://www.bls.gov/bls/news-release/cpi.htm as of September 2024.
Previous Editions:
Publications: