
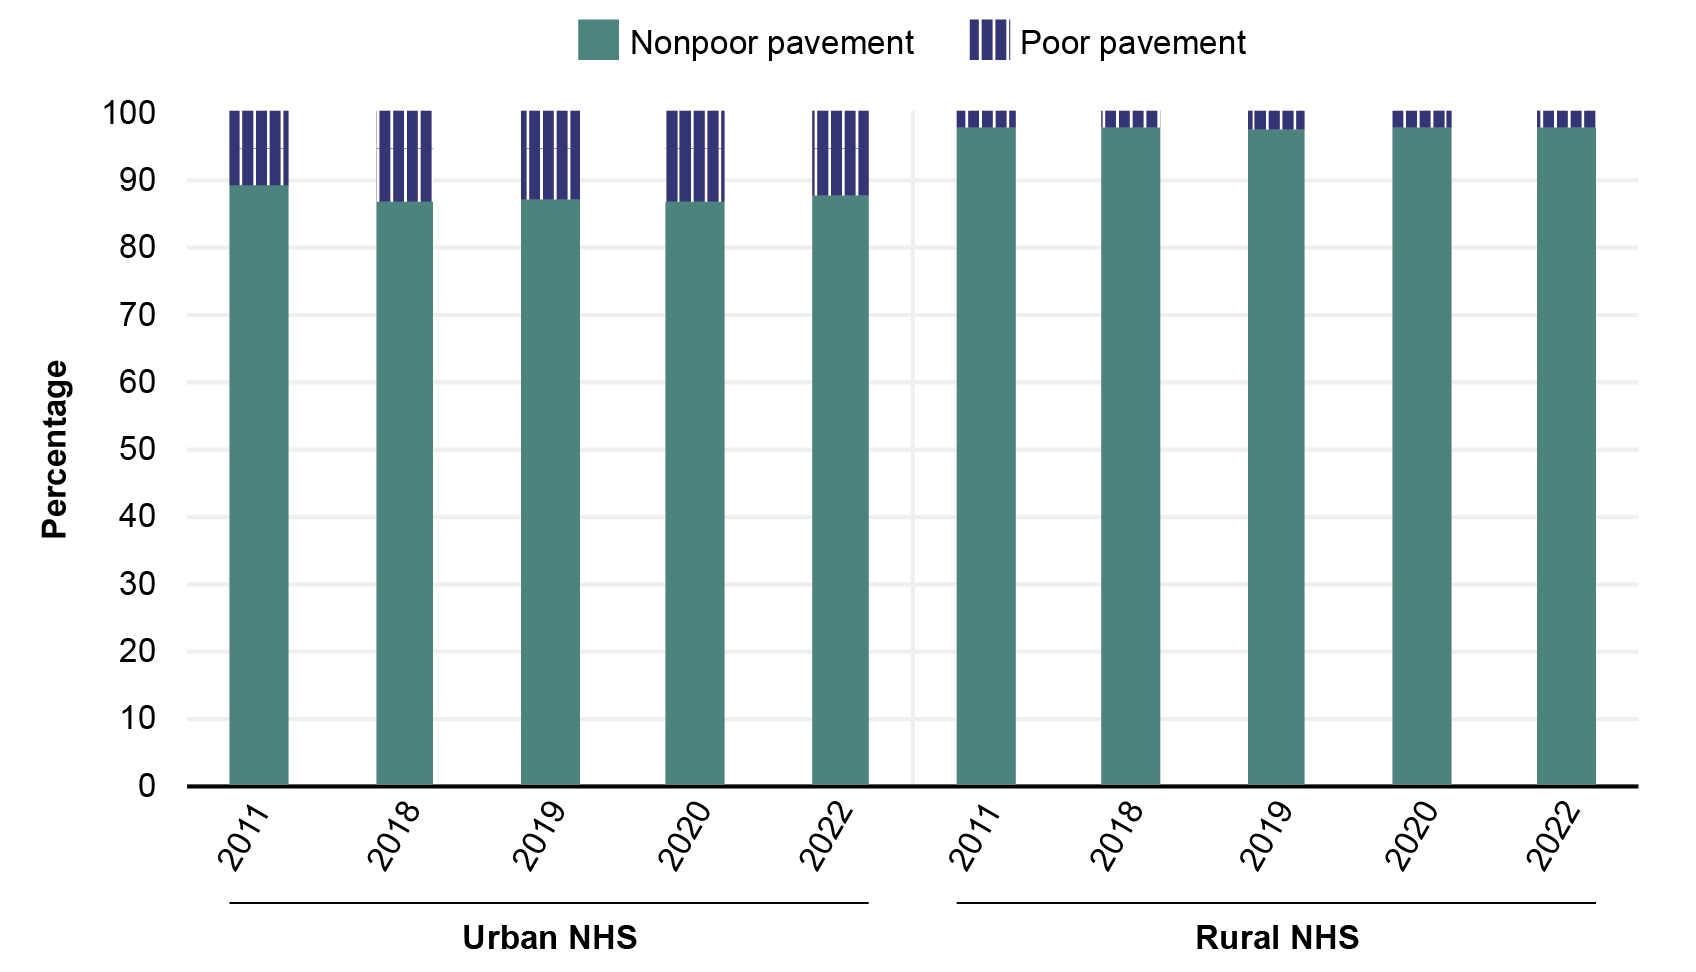
Daily Vehicle-Miles Traveled on NHS Roads With Poor Pavement Condition, Urban vs Rural 2011, 2018-2020 and 2022
Key: NHS = National Highway System; VMT = vehicle-miles traveled
Figure
Dataset Excel:
F1-4 Daily Vehicle-Miles Traveled on NHS Roads With Poor Pavement Condition, Urban and Rural NHS.xlsx (26.14 KB)Notes:
The higher functionally classified roads in the urban category include interstates, other freeways and expressways, and other principal
arterials for the entire road network. For the rural classified roads, the functional classification includes interstates and other principal arterials including those for Puerto Rico. No data were reported for 2010 due to a change in the data model, so the data reported for 2011 were used for this period. Poor condition is defined as any pavement with an IRI value greater than 170 inch/miles. No data were reported for 2021.
Description:
This graph is from the 2024 Transportation Statistics Annual Report.
Source:
U.S. Department of Transportation, Federal Highway Administration, National Highway System Length, Daily Travel by Measured Pavement Roughness – Urban and Rural. table HM-47A, available at www.fhwa.dot.gov/policyinformation/statistics/2022 as of August 2024.