USA Banner

Official US Government Icon

Official websites use .gov
A .gov website belongs to an official government organization in the United States.

Secure Site Icon

Secure .gov websites use HTTPS
A lock ( ) or https:// means you’ve safely connected to the .gov website. Share sensitive information only on official, secure websites.

U.S. Department of Transportation U.S. Department of Transportation Icon United States Department of Transportation United States Department of Transportation

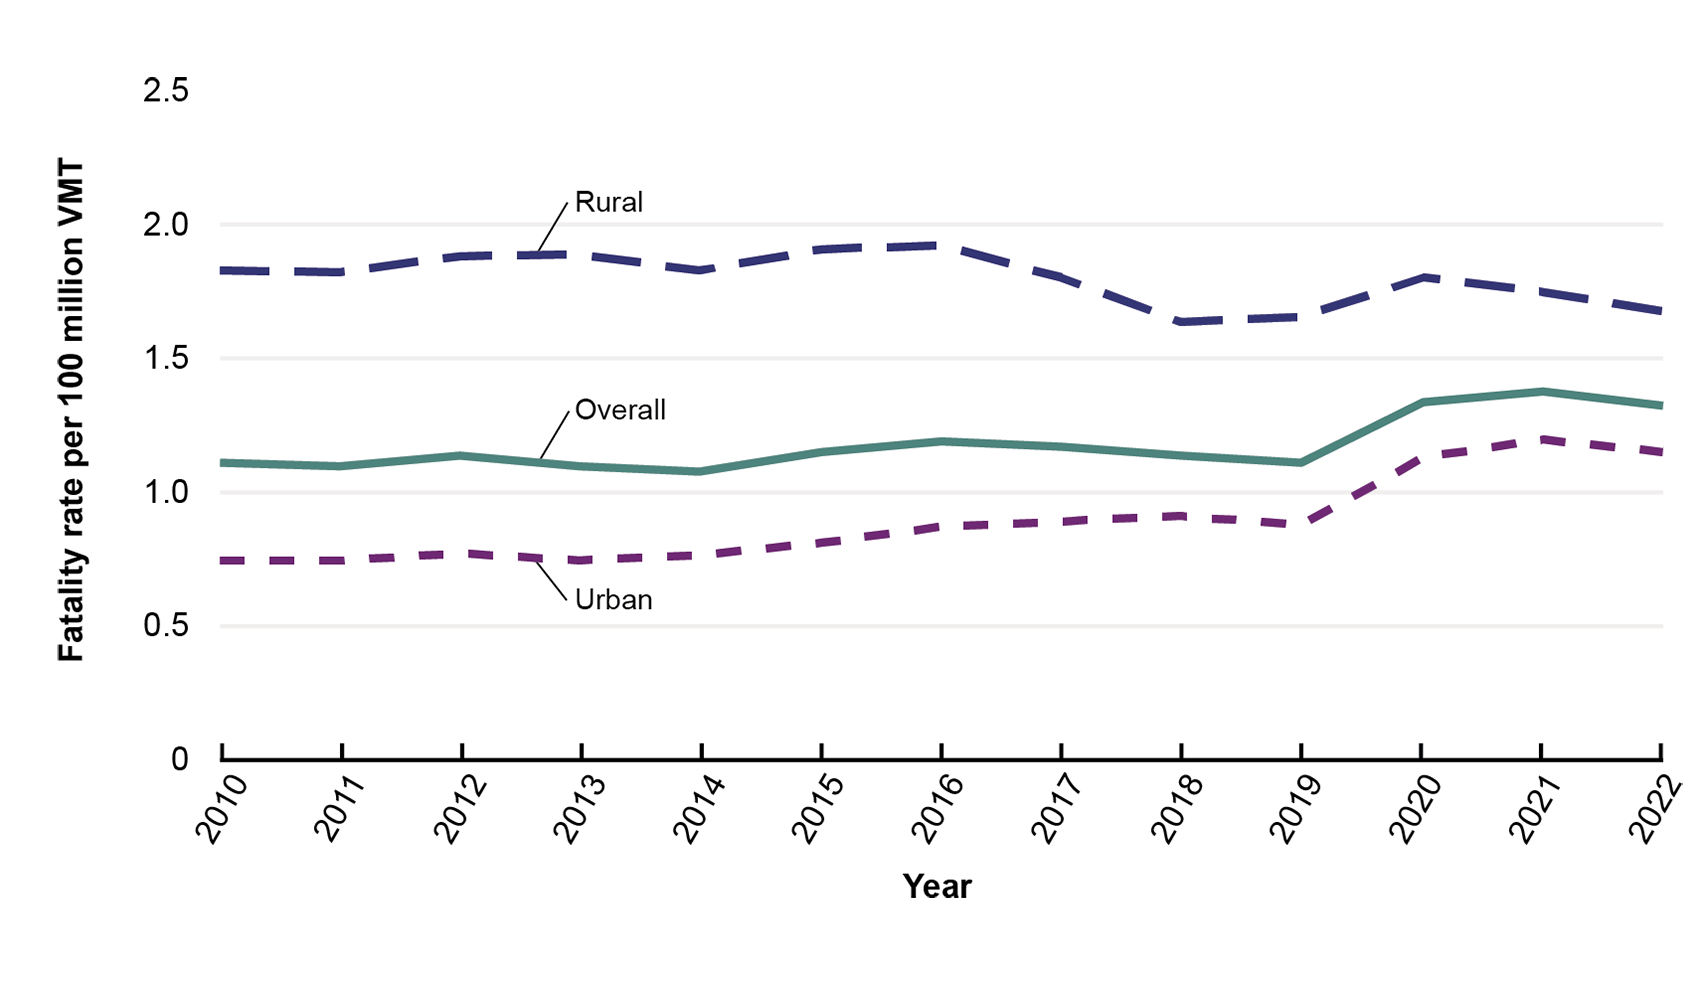
Fatality Rate per 100 Million VMT by Rural or Urban Location: 2010–2022

Figure

This line graph illustrates fatality rate by location. The x-axis represents year and ranges from 2010 through 2022. The y-axis represents fatality rate per 100 million vehicle miles traveled and ranges from 0 through 2.5. Data are plotted for rural, urban, and overall locations. Rural has the highest fatality rate, remaining between 1.8 and 2.0 until 2016, when the rate begins to slightly decline until 2018. Between 2018 and 2022, the rural rate remains steadily around 1.6 to 1.7. Urban remains steadily be

Dataset Excel:

T5-5 Hazmat Transport Incidents_0.xlsx (23.02 KB)

Description:

This table is from the 2024 Transportation Statistics Annual Report.

Source:

Source: U.S. Department of Transportation, National Highway Traffic Safety Administration. Overview of Motor Vehicle Crashes in 2021, Traffic Fatalities, by Rural/Urban Classification, June 2024. DOT HS 813 560. Available at www.nhtsa.gov/ as of July 2024.

Publications: