USA Banner

Official US Government Icon

Official websites use .gov
A .gov website belongs to an official government organization in the United States.

Secure Site Icon

Secure .gov websites use HTTPS
A lock ( ) or https:// means you’ve safely connected to the .gov website. Share sensitive information only on official, secure websites.

U.S. Department of Transportation U.S. Department of Transportation Icon United States Department of Transportation United States Department of Transportation

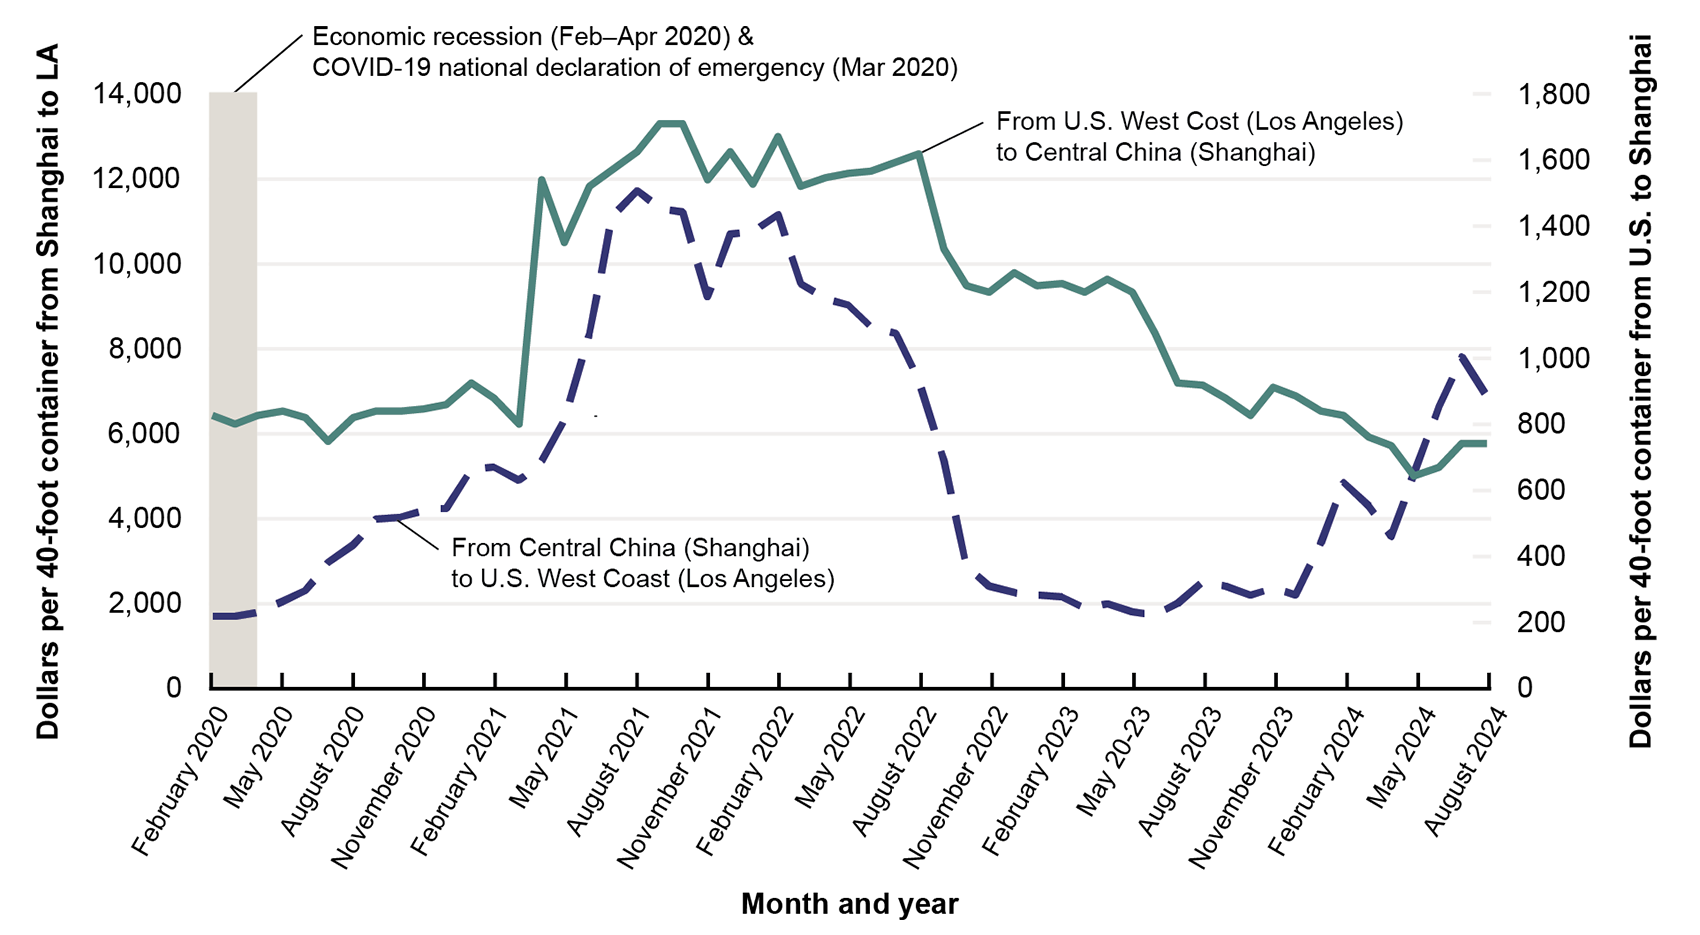
Freight Rates in Dollars per 40-Foot Container for East Bound and West Bound: March 2020–August 2024

Figure

This line graph shows freight rate in dollars per 40-foot container. Rates for East bound routes from Central China to U.S. West Coast and West bound routes from U.S. West Coast to Central China are shown. Rates for west bound routes have remined higher than for east bound routes from 2020 to March 2024.

Dataset Excel:

F4_23_Ocean_rates_v3.xlsx (71.26 KB)

Notes:

Spot ocean freight rates for a single container transaction in the selected westbound and eastbound transpacific trade routes.

Description:

This bar chart is from the 2024 Transportation Statistics Annual Report.

Source:

U.S. Department of Agriculture, Agricultural Market Service, Container Ocean Freight Rates from Drewry Supply Chain Advisors’ Container Freight Rate Insight as of September 2024.

Publications: