
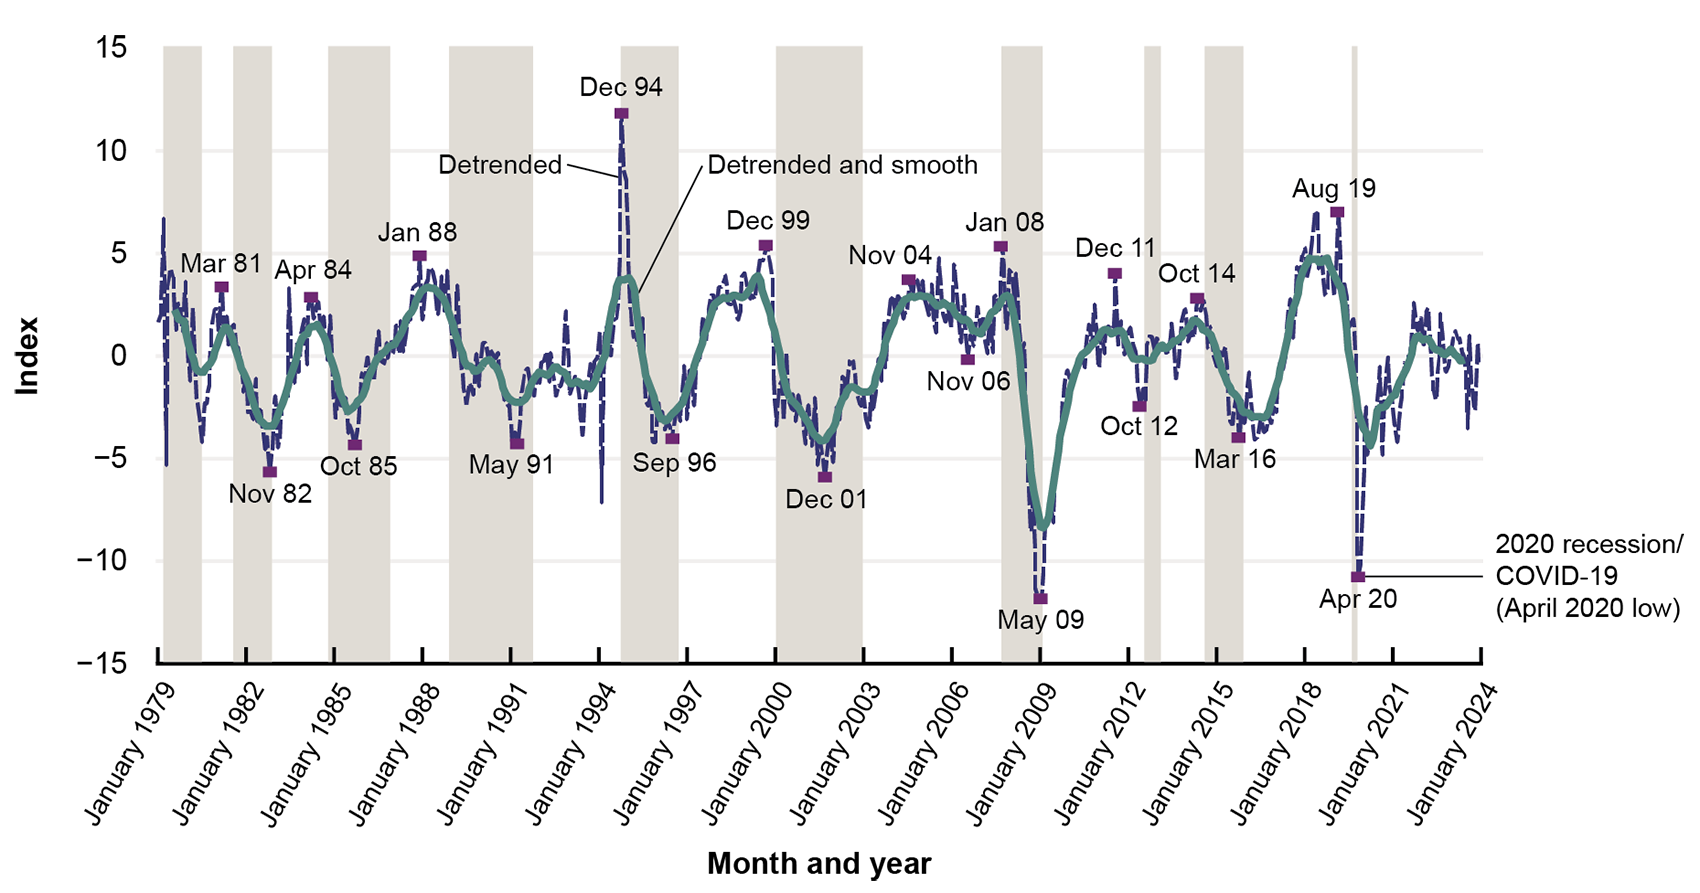
Freight Transportation Services Index and the Economic Growth Cycle: January 1979–June 2024
Figure
Dataset Excel:
F4_04_TSI_freight_detrended.xlsx (74.29 KB)Notes:
Shaded areas indicate decelerations in the economy, and areas between are accelerations in the economy (growth cycles). The endpoint for deceleration began in December 2014 has not been determined. Detrending and smoothing refer to statistical procedures that make it easier to observe changes in upturns and downturns of the data. Detrending removes the long-term growth trend and smoothing removes month-to-month volatility.
Description:
This line graph is from the 2024 Transportation Statistics Annual Report.
Source:
U.S. Department of Transportation, Bureau of Transportation Statistics, Transportation Services Index, available at https://data.bts.gov/stories/s/9czv-tjte as of September 2024.
Previous Editions:
Publications: