
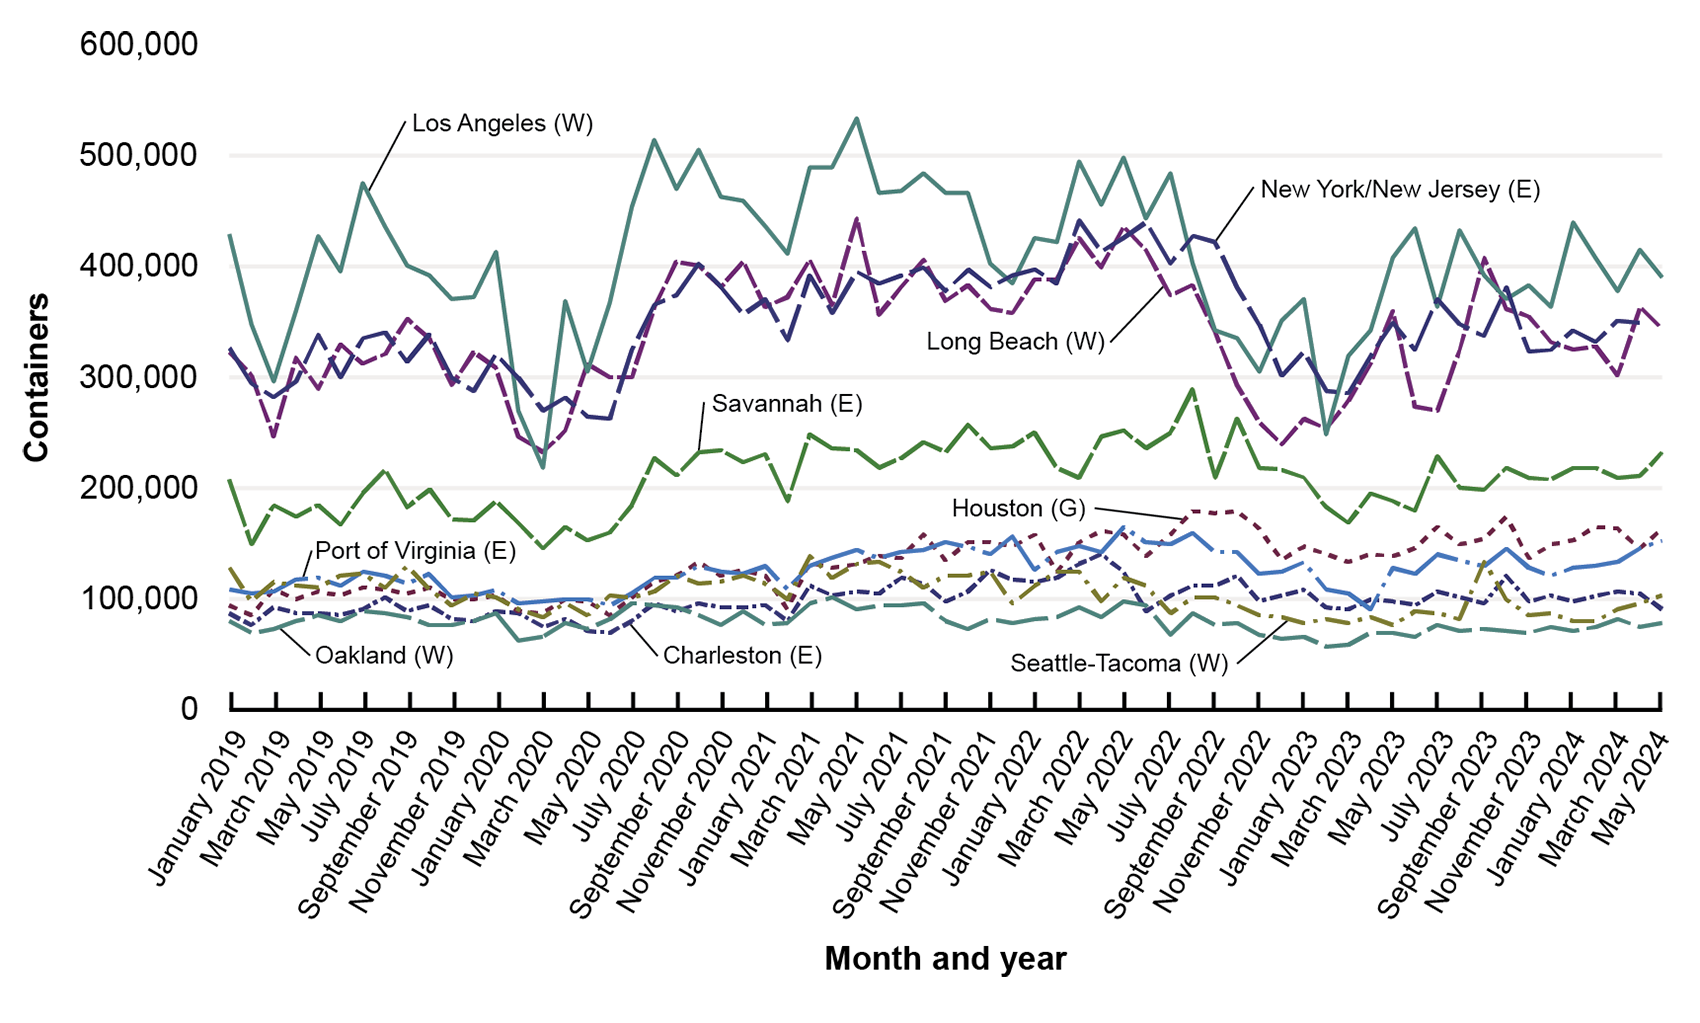
Loaded Import and Export Containers at Select Ports: 2019-2024
Key: E = East Coast; W = West Coast; G = Gulf Coast
Figure
Dataset Excel:
F1-21A&B Loaded Containers.xlsx (84.09 KB)Description:
This graph is from the 2024 Transportation Statistics Annual Report.
Source:
Reprinted from U.S. Department of Transportation, Bureau of Transportation Statistics, Supply Chain and Freight Indicators Dashboards, available at https://www.bts.gov/freight-indicators#loaded-import as of August 2024; U.S. Department of Transportation, Bureau of Transportation Statistics, Supply Chain and Freight Indicators Dashboards, available at https://www.bts.gov/freight-indicators#loaded-export as of August 2024.
Previous Editions:
Publications: